COMPLEXITYCLARITY
 · Bengaluru, India
I turn complex workflows, data and AI into enterprise products teams can actually use and measure.
Associates · Sourcing Managers · Merchants · Business Teams
I don't define myself by titles —
I define myself by the products I help build.


Turning supplier data into sourcing decisions.
Product Strategy · System Design
I connected discovery, assessment, comparison and benchmarking into one supplier evaluation experience—reducing manual work and helping teams make faster, more informed decisions.
Less manual evaluation. Faster supplier decisions. Higher adoption of the workflow.
Untangle workflows and dependencies across teams.
Make complex data actionable.
Build clarity without losing depth.
Selected work
View all workSystems designed to make complex enterprise work simpler.
 View case study ↗
· Enterprise AI2025–Now
View case study ↗
· Enterprise AI2025–NowSupplier Matrix
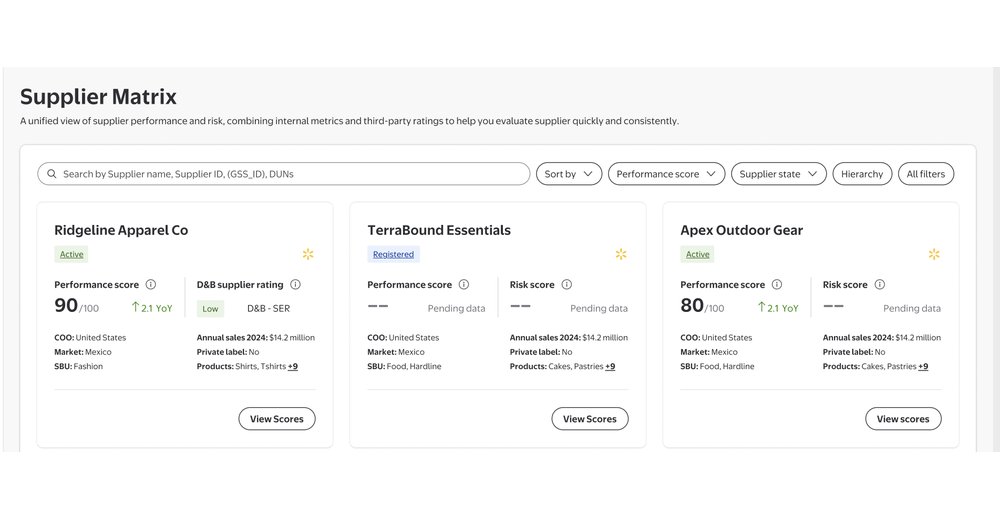
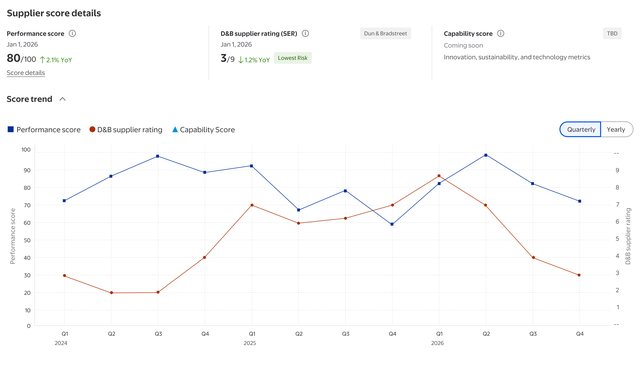
Performance, risk, and capability signals lived across fragmented systems. Supplier Matrix unified them into one trusted decision layer for supplier discovery, evaluation, and monitoring.
From fragmented signals to faster, more confident supplier decisions.
6+ SBUs · 4+ Markets · Released Q1 2026 · Piloted across every SBU

 View case study ↗
· Enterprise AI2026–Now
View case study ↗
· Enterprise AI2026–NowScintilla × Supplier One
Turned inventory gaps into explainable recommendations suppliers can act on inside Supplier One.
Alert → Insight → Recommendation → Action
From inventory gaps to actionable replenishment in Supplier One.
Released Q2 2026 · Integrated with Supplier One
 View case study ↗
· Ops2022–23
View case study ↗
· Ops2022–23Omni Routes
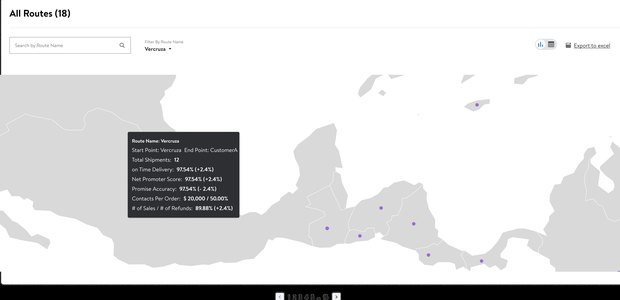
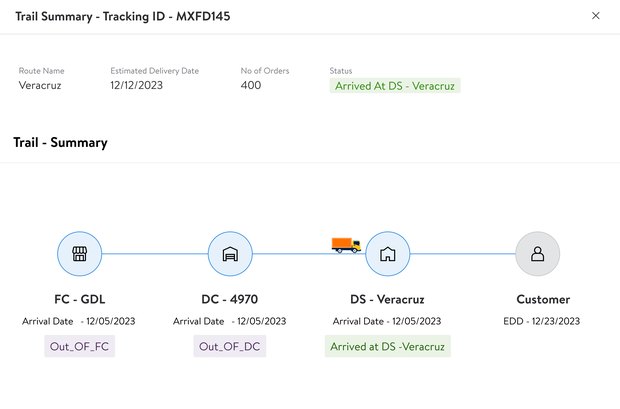
Real-time shipment visibility across fulfillment, distribution, and last-mile operations — because teams lost visibility across every handoff.
Every handoff used to be a black box. Now it's one trackable journey, start to finish.
Live since 2022 · Powering eCommerce operations across MX
SME Pay Later
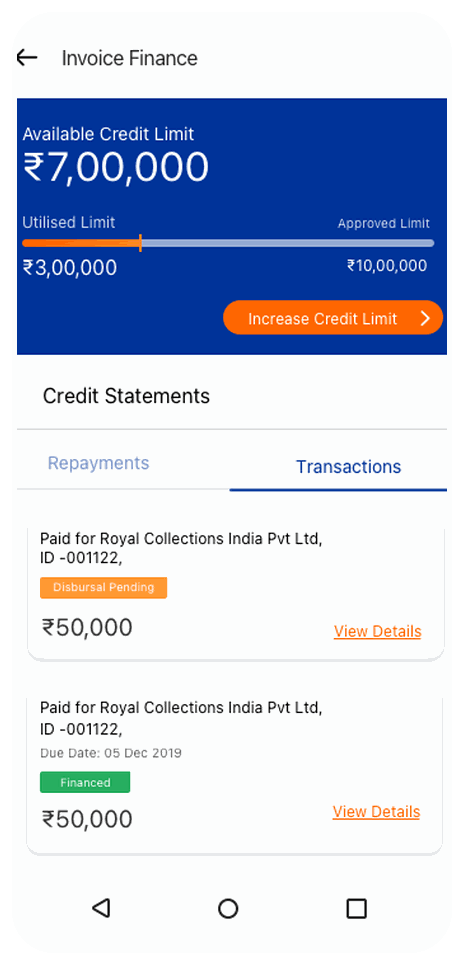
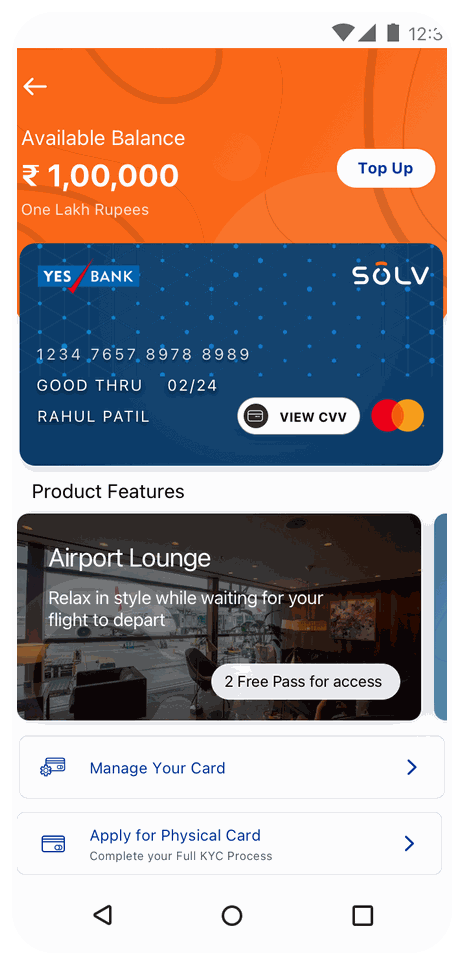
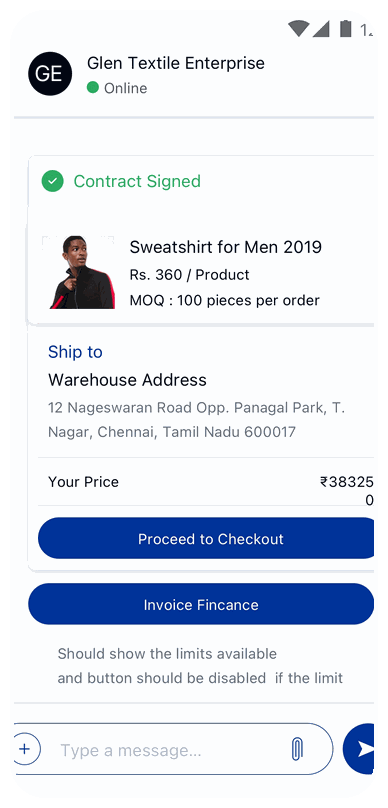
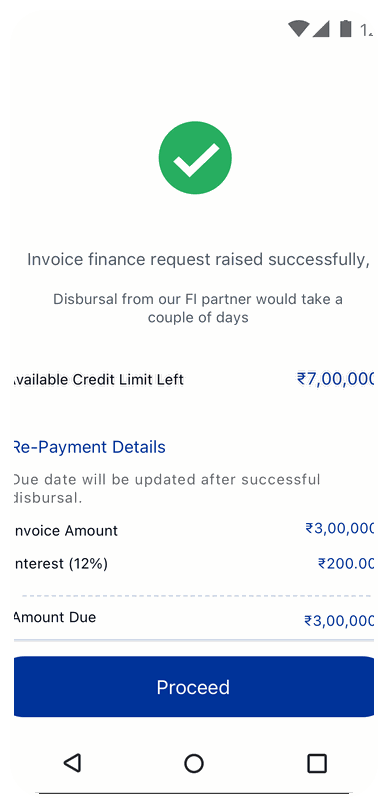
Helping small businesses access flexible working capital — from ₹3,000 up, with 15–60 day credit terms — without the friction of traditional credit.
Getting working capital used to mean weeks of paperwork. Now it's a credit line that updates itself.
Launched in 2021 · Digital Credit & Pay Later · MSME Platform

 View case study ↗
Bawsala
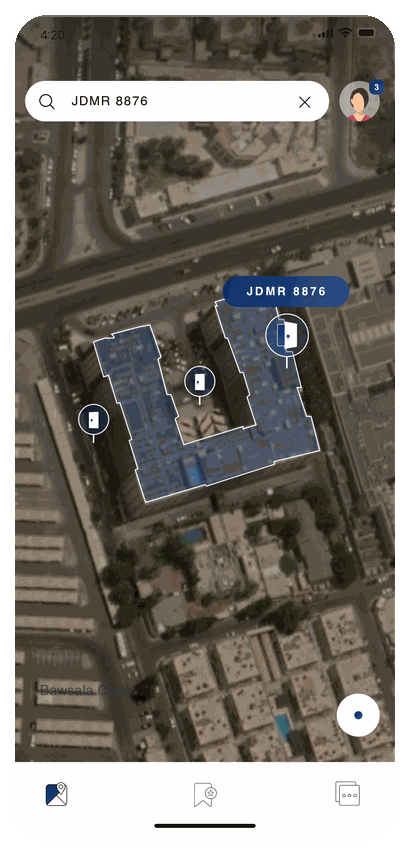
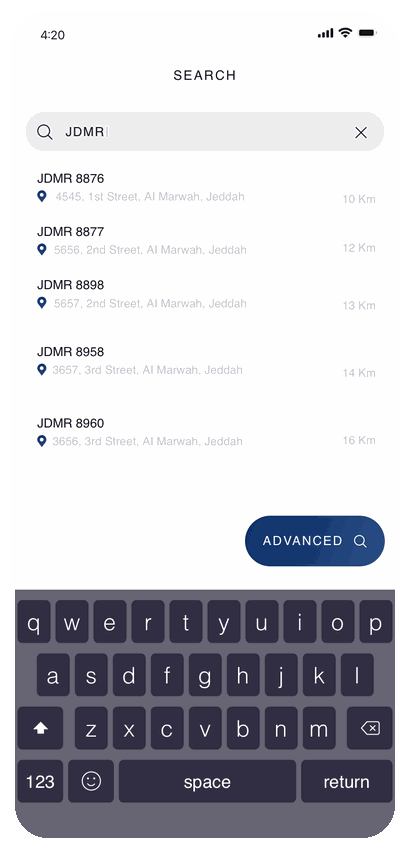
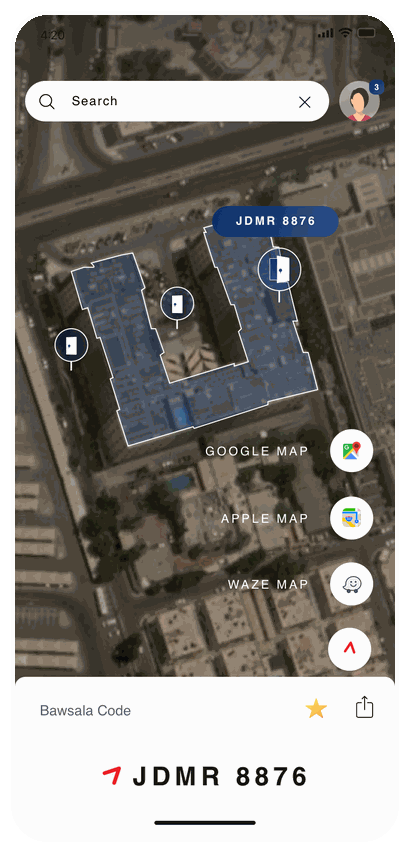
Helping people find the right building entrance — not just the right address — with a unique code for every entrance, searchable and shareable in seconds.
One address, many entrances — each gets a unique Bawsala code.
Launched in 2018 · Location discovery · Navigation · Maps
 View case study ↗
 · Logistics2020–22
Delivery Planning
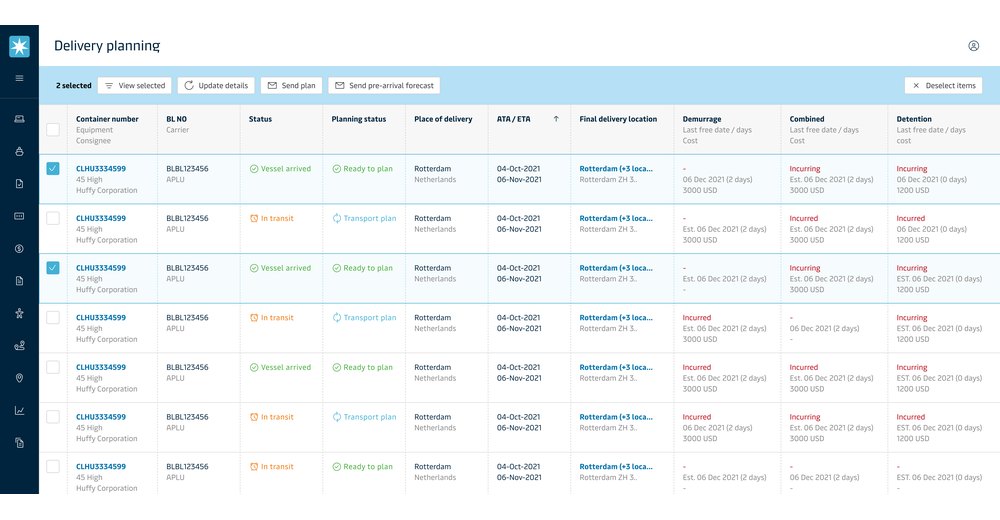
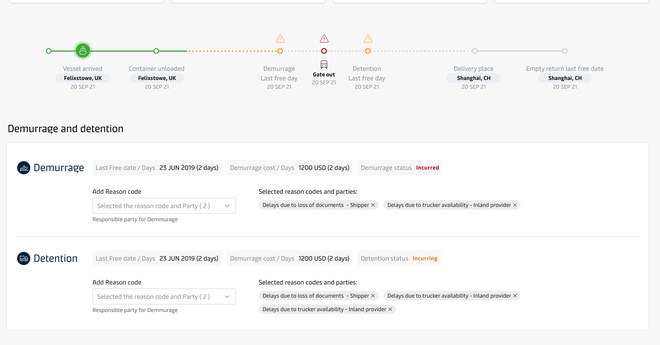
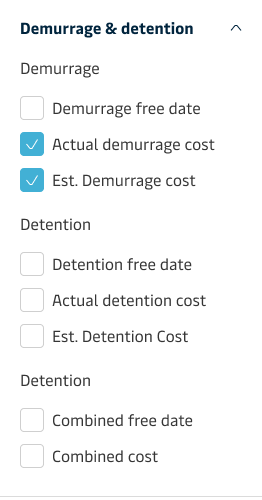
Bringing fragmented delivery milestones into one planning experience—improving visibility and reducing preventable demurrage and detention costs.
Turning scattered milestones into one plan teams can act on.
Live since 2020 · Ocean logistics · Demurrage & detention

Bring me the messy part.
I'll help make sense of it.
Complex workflows. Fragmented systems. Too much data. That's where the interesting problems begin.



Making complexity
feel simple.
A selection of products, systems and experiments shaped across fintech, AI, enterprise and everyday life.
Prototypes, experiments
and ideas beyond the brief.
Things I prototype, test and explore when there isn't a brief.

I'm Saiky (Saikiran Desai), a product designer in Bengaluru. I design complex products and turn them into experiences people can actually use.
I've worked with Walmart, Maersk, SOLV, and Standard Chartered, designing products across enterprise, fintech, and emerging businesses.
Right now, I'm exploring how AI is changing the way we design, build, and interact with products — and what that means for the future of product design.
Four habits that shape
everything I ship.
Frame
I don't jump straight into solutions. I start by understanding why the problem exists, who it affects, what constraints matter, and what happens if we don't solve it.
Frame the problem before framing the solution.
Make visible
I share rough flows, concepts, and prototypes early so teams can react, challenge, and shape the direction before it becomes expensive to change.
Make thinking visible while it is still cheap to change.
Prototype
I use AI-assisted tools to turn ideas into working prototypes, test interactions early, and learn faster. The goal isn't to replace design thinking—it's to make ideas tangible sooner.
Turn ideas into something real enough to test.
Measure
Good design should change something for the better. I think beyond screens and consider the impact on users, the business, and the teams building and scaling the product.
Design beyond the screen. Measure what changes.
A decade of moving from interfaces to complex product systems.


Tennis
Most weekends, whatever the heat.
Solo backpacking
Himalayas, Nepal — usually with one backpack and no fixed plan.
Acrylic painting
Mostly abstract. Occasionally something that actually looks intentional.
Content creator
Travel, fashion, lifestyle, and whatever catches my eye.
Vibe-coding
Building the thing instead of just describing it.
Music & coffee
South Indian filter coffee. Good music. Repeat.






Trust the next step before you can see the whole path.Saiky
Let's make something good — together.
Everyone had supplier data. Nobody had one way to make supplier decisions.
Turning fragmented supplier data and inconsistent evaluation into a trusted enterprise decision system.

This case study is protected under NDA.
The full screens, design process, and product rationale are available to approved reviewers. Enter your password below, or request access for the complete walkthrough.
A supplier lookup problem became an enterprise decision system.
One trusted starting point
Bring supplier information, performance and risk into a shared evaluation experience.
Less manual synthesis
Connect discovery, evaluation, comparison and monitoring instead of making associates reconstruct the story.
Foundation for intelligence
Establish the structure for capabilities, Supplier Insights, semantic search and proactive recommendations.
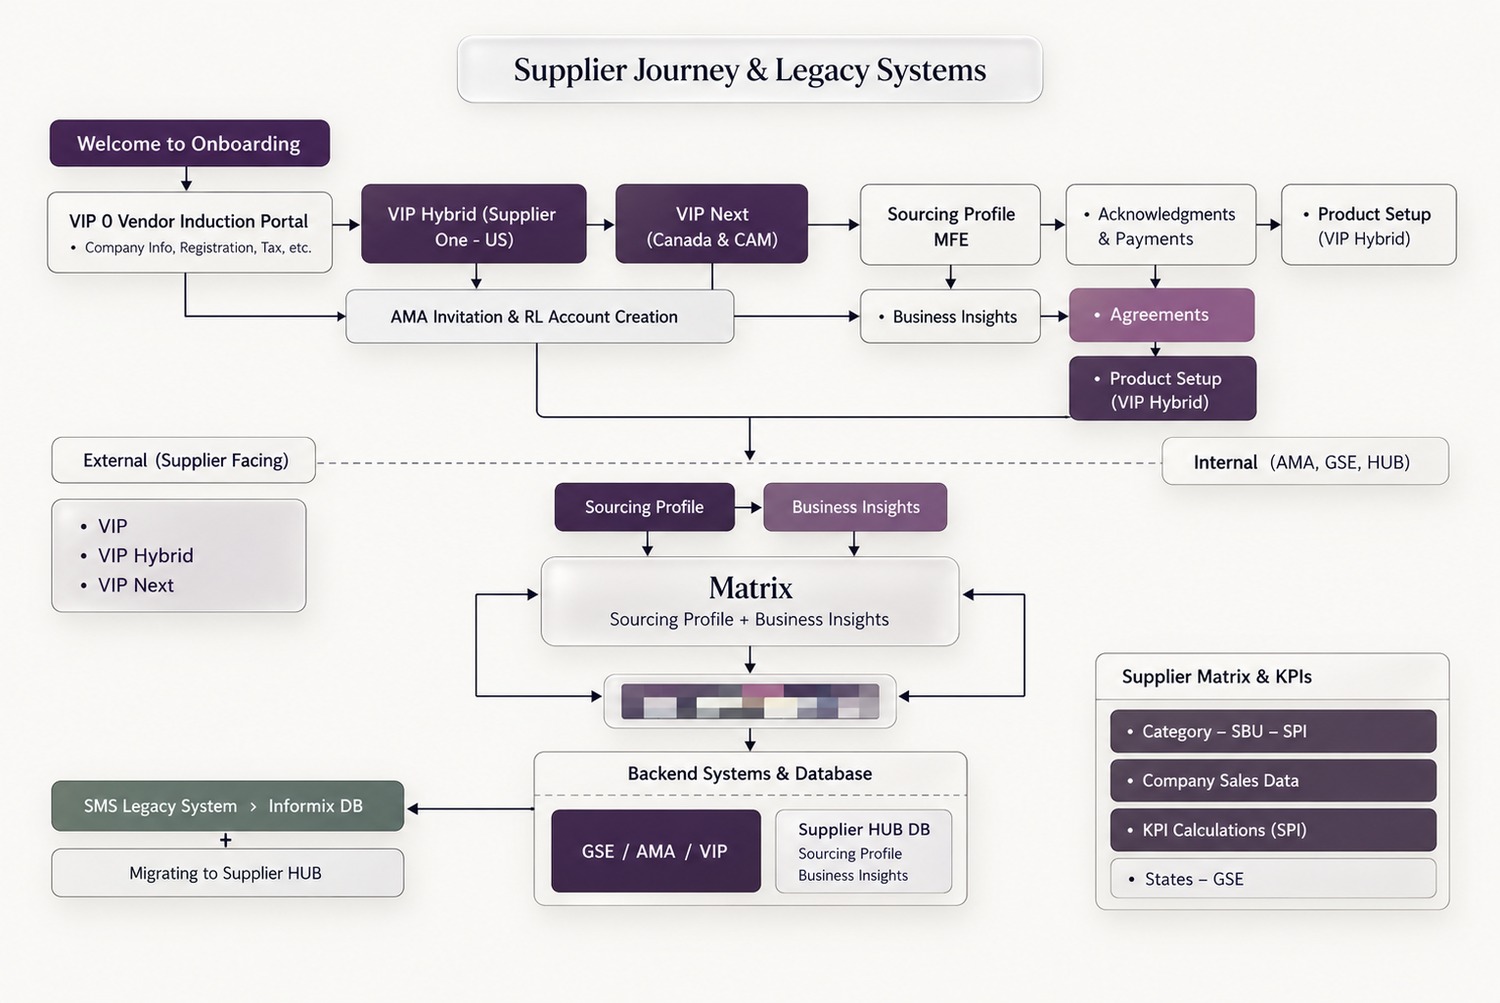
Supplier decisions were fragmented across data, systems and people.
Performance, risk and capability signals lived in different places. Teams applied inconsistent evaluation criteria. Supplier discovery depended heavily on manual networks, and a score alone could not provide the context needed for a confident decision.
Fragmented supplier data
Signals distributed across systems and teams.
One supplier view
A shared profile for supplier intelligence.
Inconsistent evaluation
Different signals and criteria shaped different decisions.
One evaluation framework
Performance · Risk · Capability.
Manual discovery
Peer networks, spreadsheets and multiple tools.
Unified discovery
Search, filter, compare and monitor.
Scores without context
A number alone did not create confidence.
Explainable evaluation
Score → drivers → trend → context.
I translated an ambiguous enterprise problem into a coherent supplier decision experience.
My role was to make complex business and data logic understandable and actionable—not to define that logic alone.
Decision model
Turn broad supplier-management needs into the questions associates needed the product to answer.
Information architecture
Organize supplier identity, Performance, Risk, Capability and deeper context into a usable hierarchy.
Core workflows
Discovery, profile, score details, comparison, category context, monitoring and insights.
Evidence → iteration
Partner with research and product to test assumptions and turn findings into design decisions.
Discovery clarified the jobs the Supplier Profile needed to support.
I filtered the workshop output to the needs directly relevant to Supplier Matrix: centralized supplier context, capability visibility, evidence-based assessment, faster discovery and consistent shortlisting.
"Supplier Matrix really helps reduce the grunt work here."
Four profile-relevant jobs emerged from discovery.
What is possible?
Explore the capabilities of existing and potential suppliers.
Is this supplier viable?
Use centralized assessment, readiness, capability, risk and performance context.
Who should I prioritize?
Rank suppliers more consistently using cost, history, reliability and business context.
Where else can I look?
Develop the supplier pool when existing options cannot meet the need.
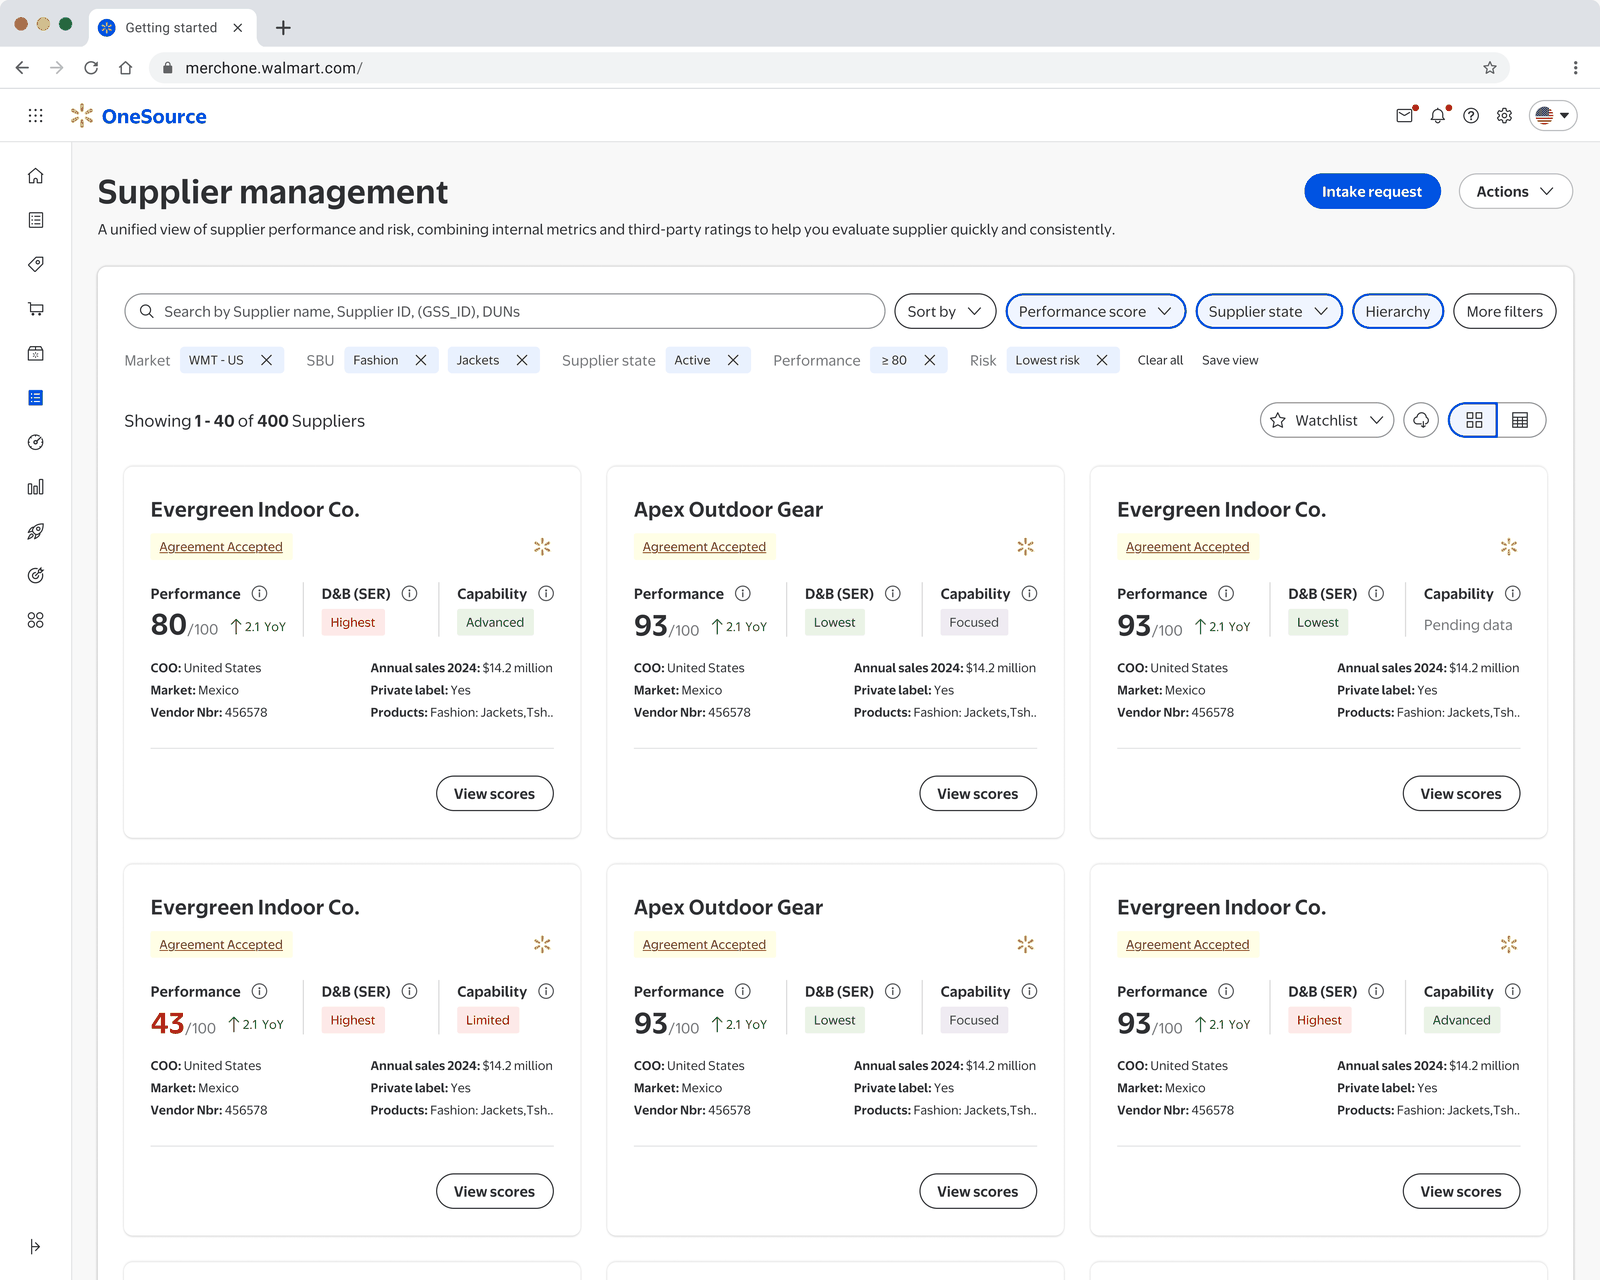
Centralize supplier context
Internal teams needed reliable supplier information in one place instead of reconstructing it across sources.
Reveal capability
Product- and item-level capability helps teams understand supplier fit, potential and negotiation context.
Reduce search effort
Workshop notes called for reducing manual effort across long supplier lists and improving filtering.
Build consistency
Associates wanted clearer criteria for supplier ranking rather than inconsistent manual comparison.
We didn't need another supplier database. We needed a decision layer on top of supplier data.
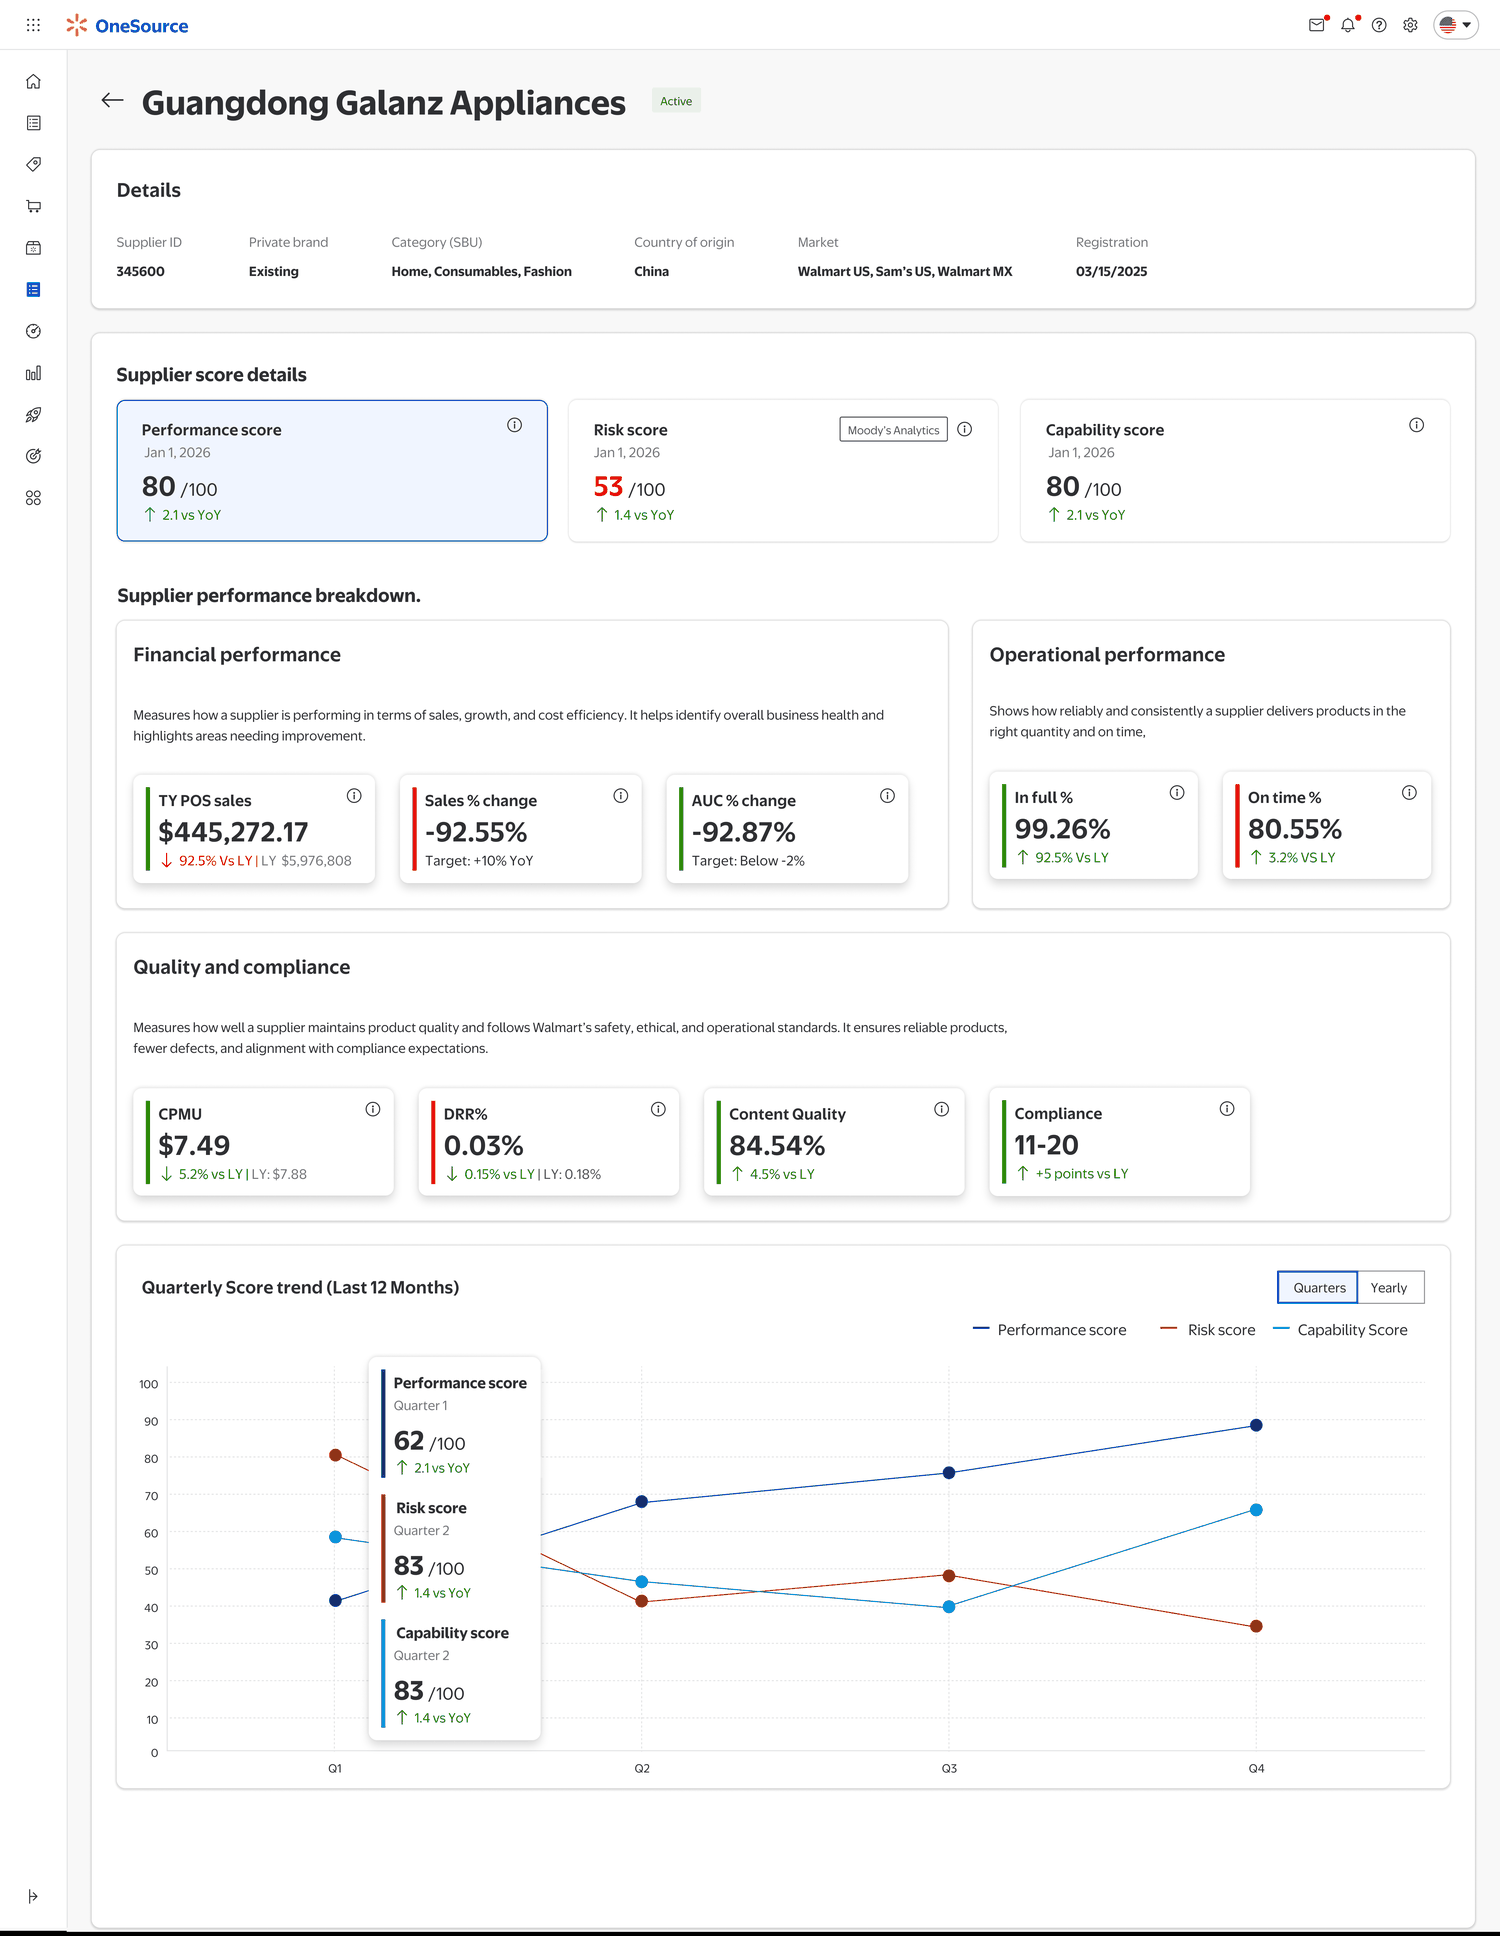
Three dimensions turned a large signal set into an understandable mental model.
How are they doing?
A standardized view of supplier performance and the metrics driving it.
What needs attention?
Financial and risk context to support screening and additional review.
What can they do?
Signals about the supplier's ability to execute, scale and support opportunity.
Designing simplicity on top of scoring complexity
The Performance Score combines signals with different units, directions, levels of supplier control and business importance. The UX challenge was not to simplify the calculation—it was to simplify how associates understand it without hiding how it works.
We had a model. Next, we needed to know if people understood and trusted it.
9 participants—5 Sourcing Managers and 4 Merchants—reviewed in-progress concepts in 30-minute remote interviews across Food, General Merchandise and Health & Wellness.
Logo → useful identity
Finding: Most users did not value logos in long supplier lists.
Decision: Prioritize supplier identity, address/location and useful metadata.
Unsettled terminology → clear mental model
Finding: "Risk" was the most understood label; higher risk was expected to be worse.
Decision: Keep Risk and make direction/severity explicit.
Score → evidence
Finding: Scores supported shortlisting, but users wanted metrics, commentary and category relevance.
Decision: Treat the score as an entry point into deeper evidence.
Structured data → structured + human knowledge
Finding: Prior contacts and factory-visit history influenced confidence.
Decision: Preserve paths to qualitative supplier context where available.
"We have a Teams chat. I can ask, 'Does anyone know this supplier?' and it saves a whole bunch of time."
"I like the bottom metrics details — that shows where they fall on that risk and what the commentary is."
"I like to see the graph first because that shows me a timeline too of how those metrics have changed, and if I wanted to double-click into that, I can scroll down and see the actual numbers there."
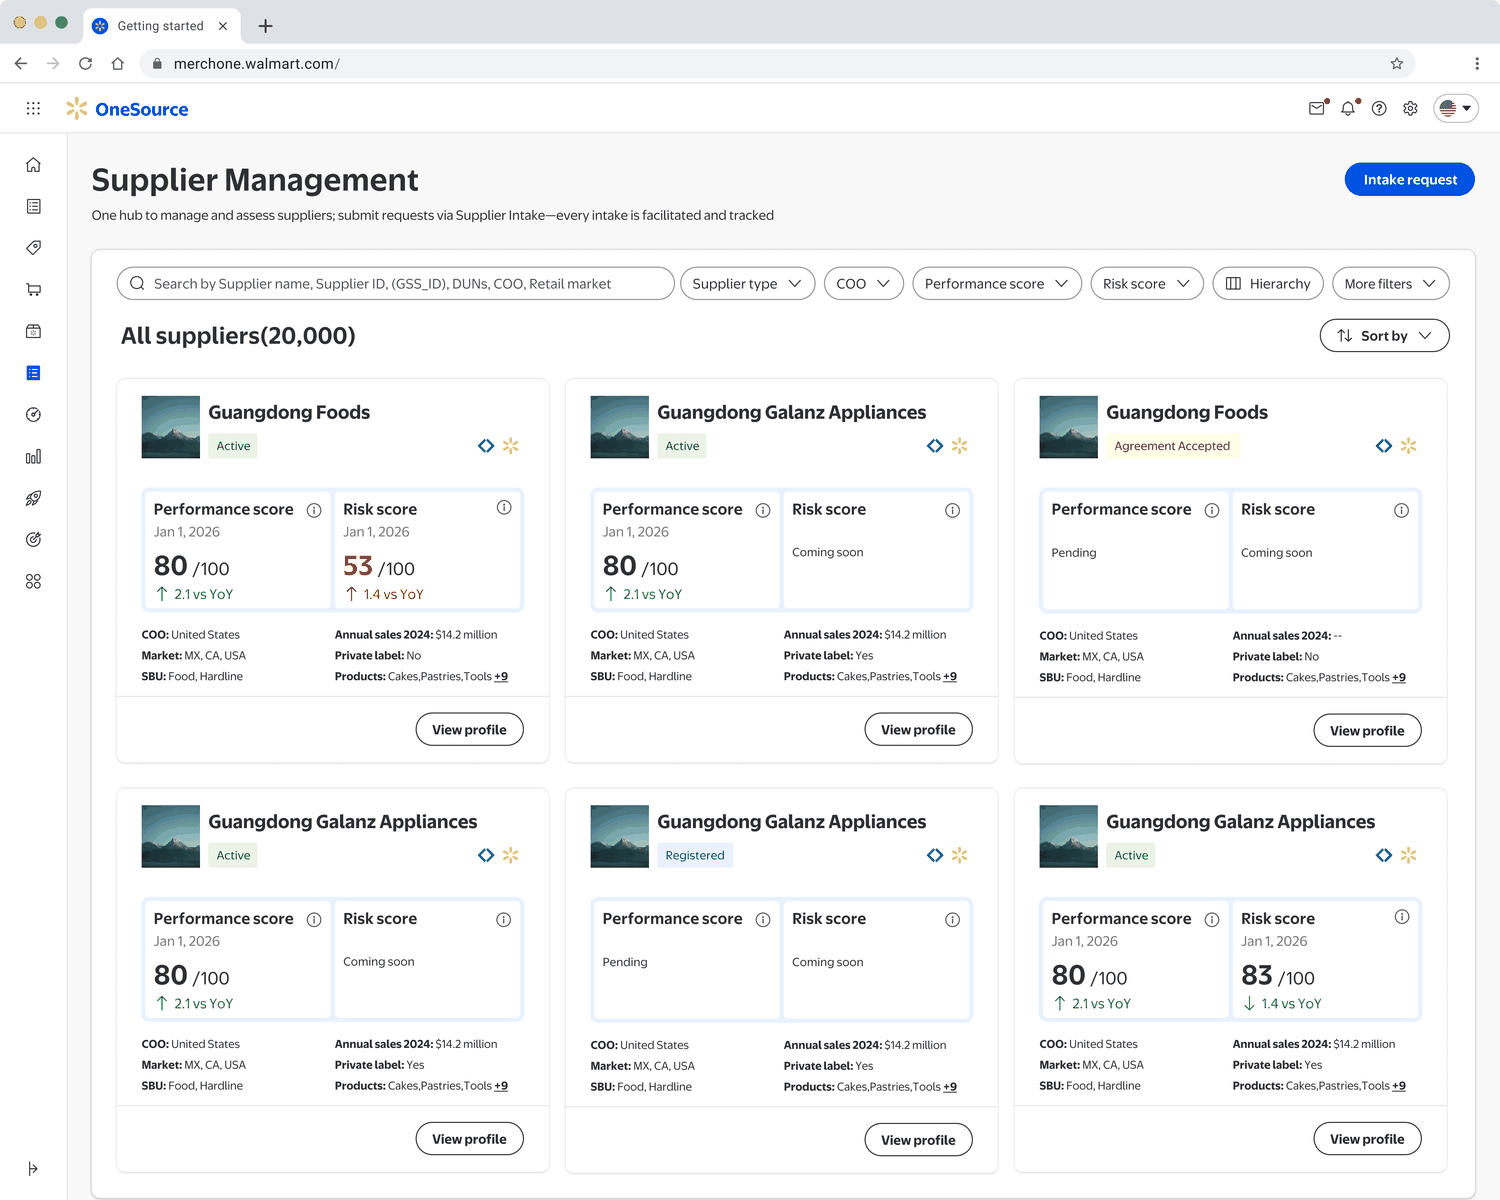
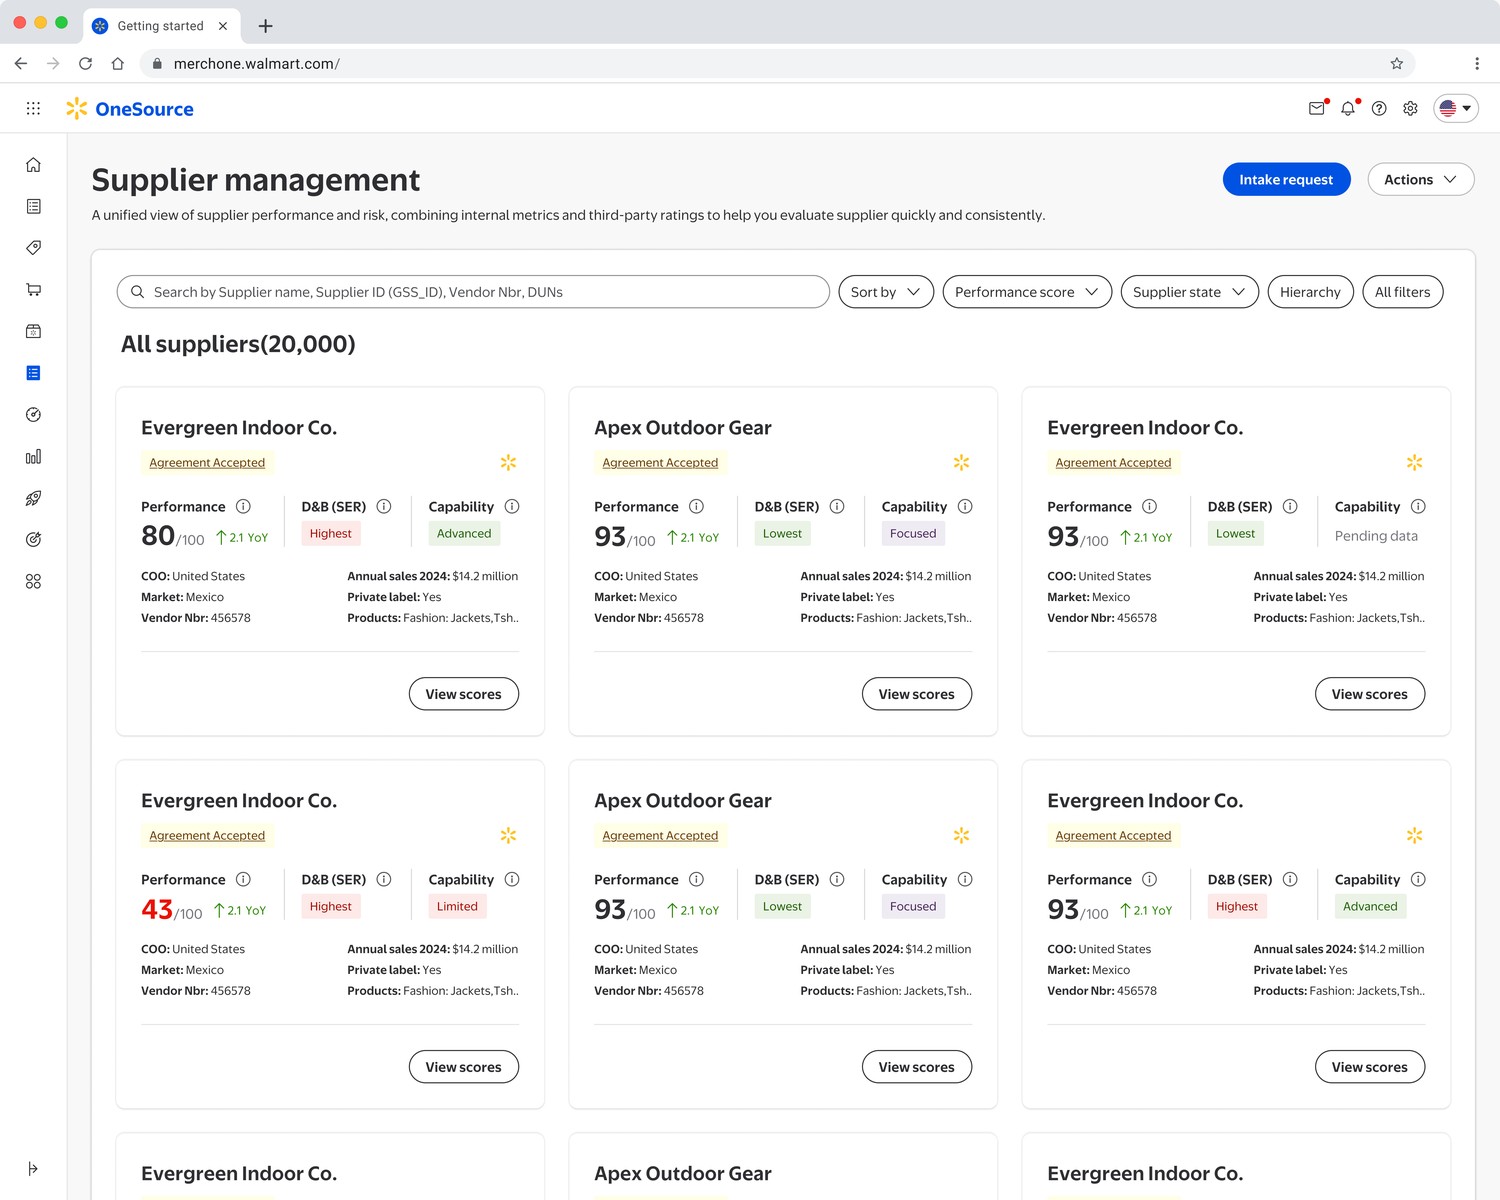
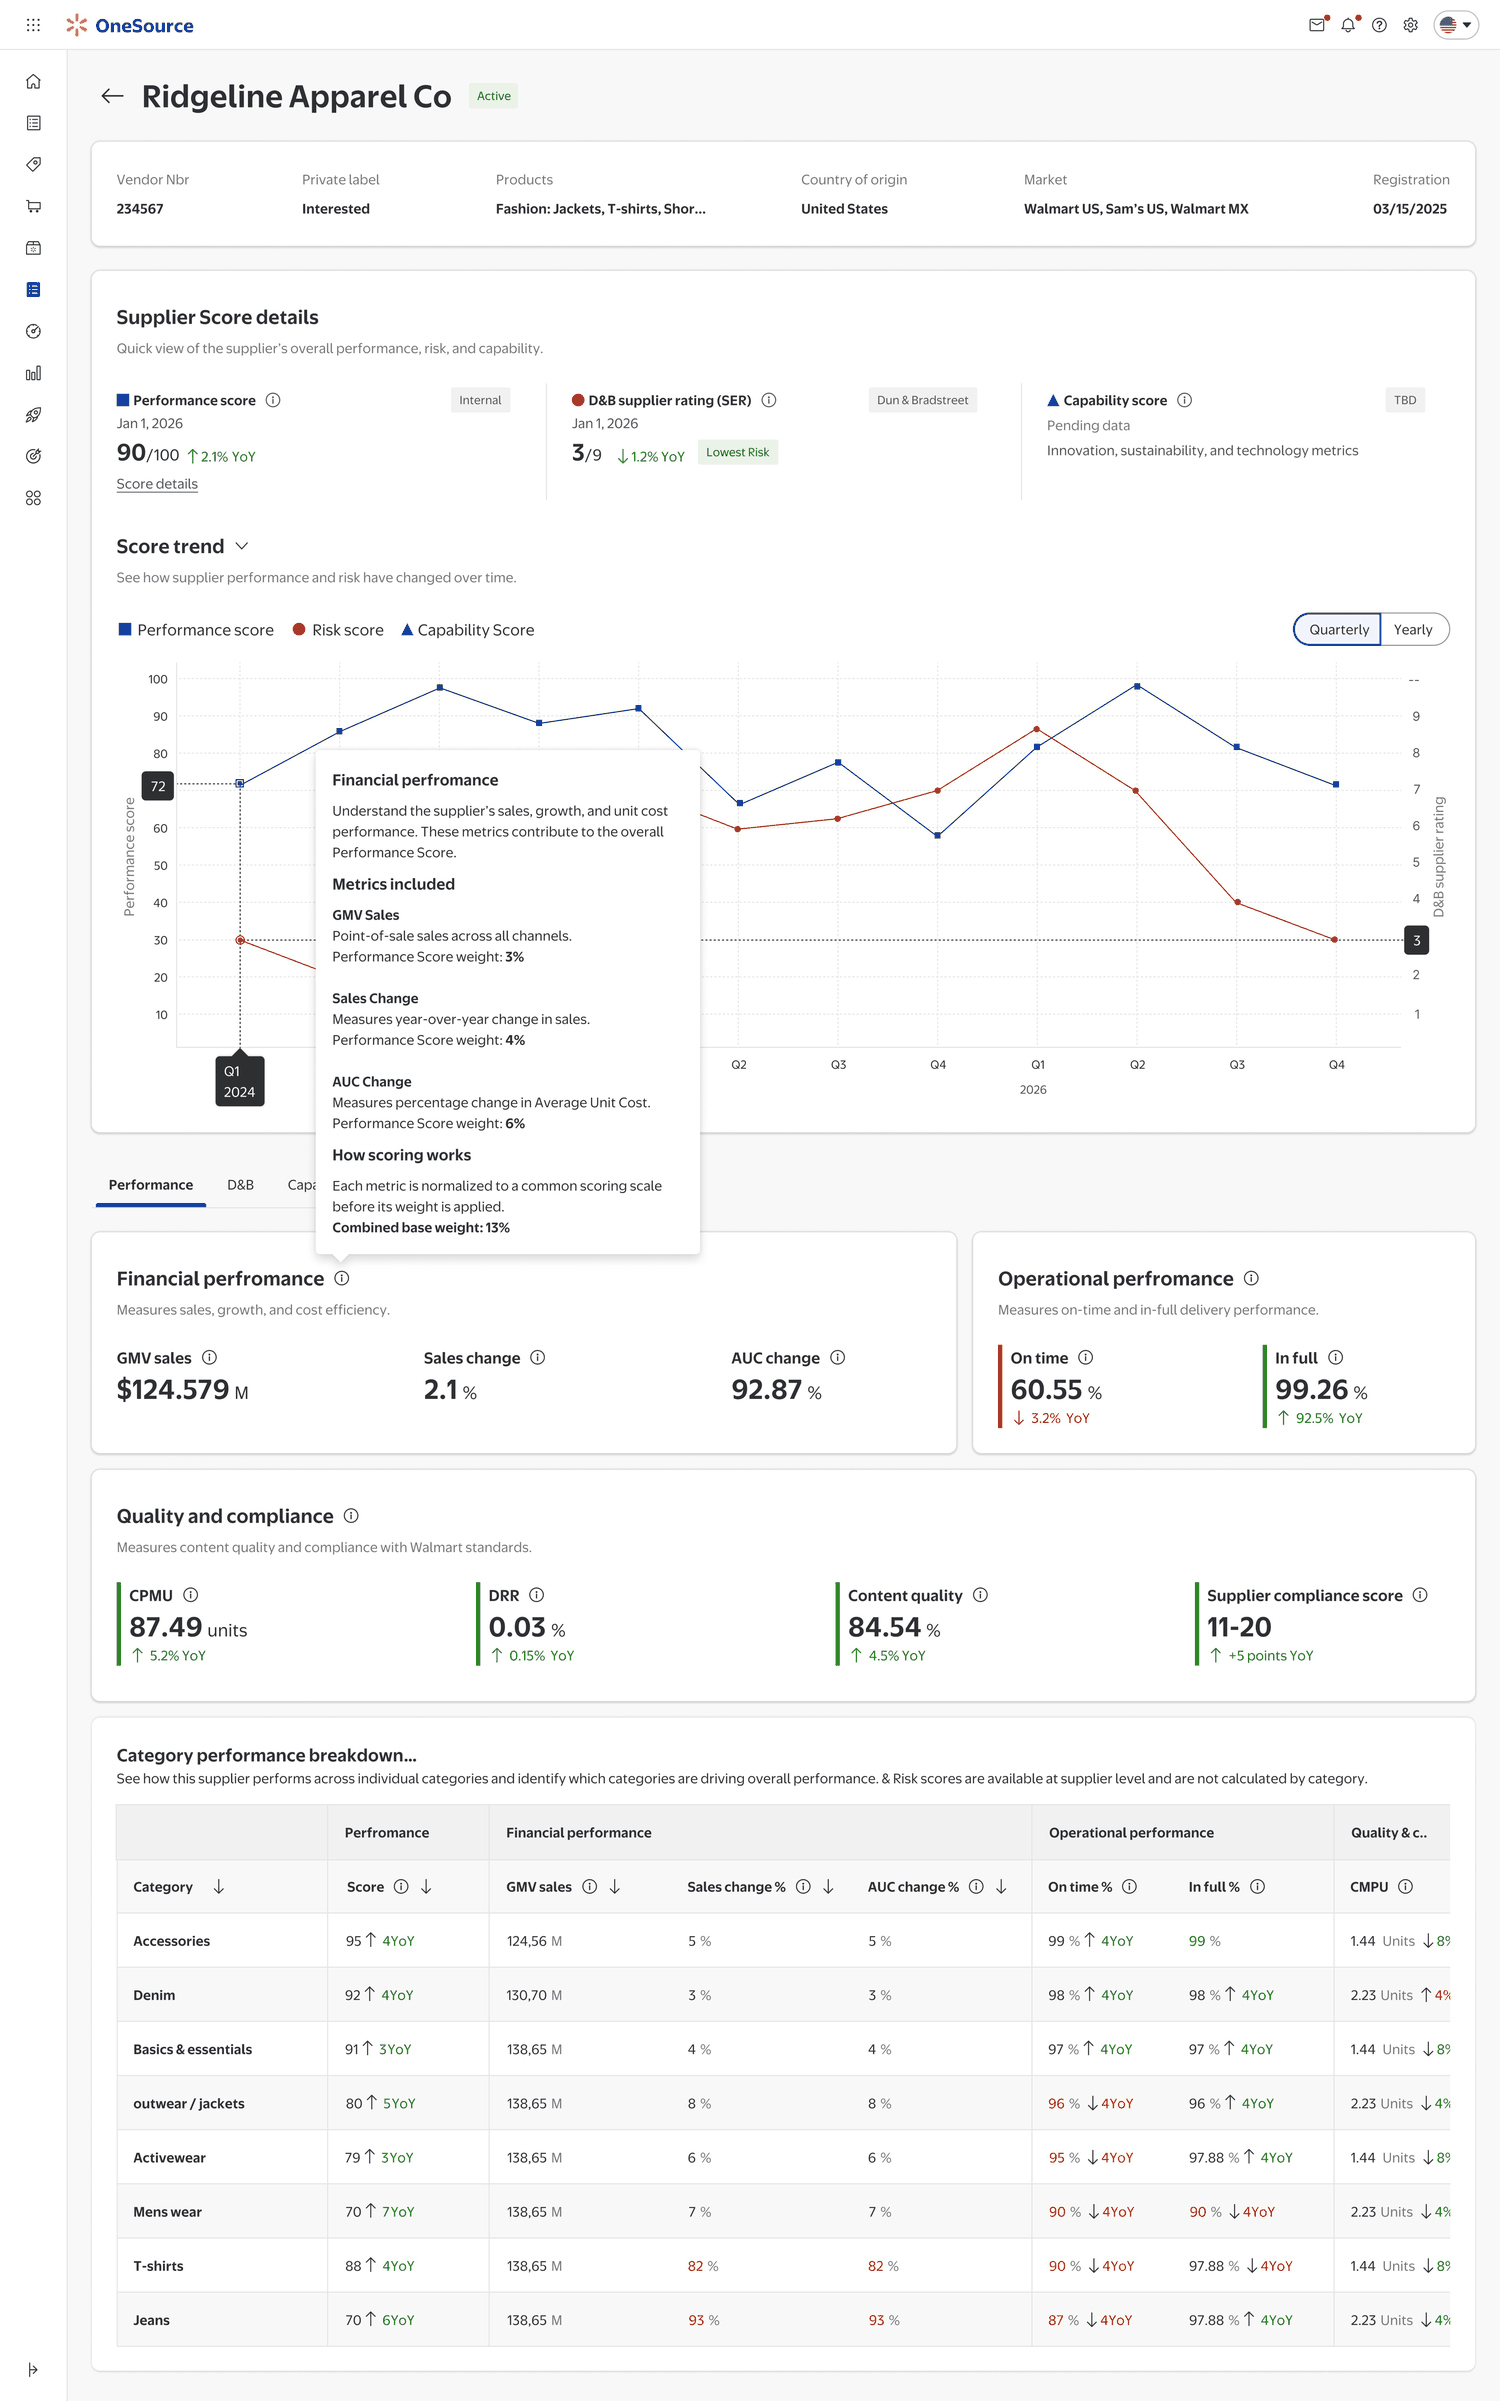
Find → Understand → Evaluate → Monitor.
Find the right supplier
Search, filter and shortlist around business-relevant criteria.
Build the supplier picture
Identity, Performance, Risk, Capability and related context in one profile.
Move from score to evidence
Drivers, trends, comparison and category detail support judgment.
Know what changed
Watchlists, alerts and Supplier Insights move the product from lookup to ongoing intelligence.
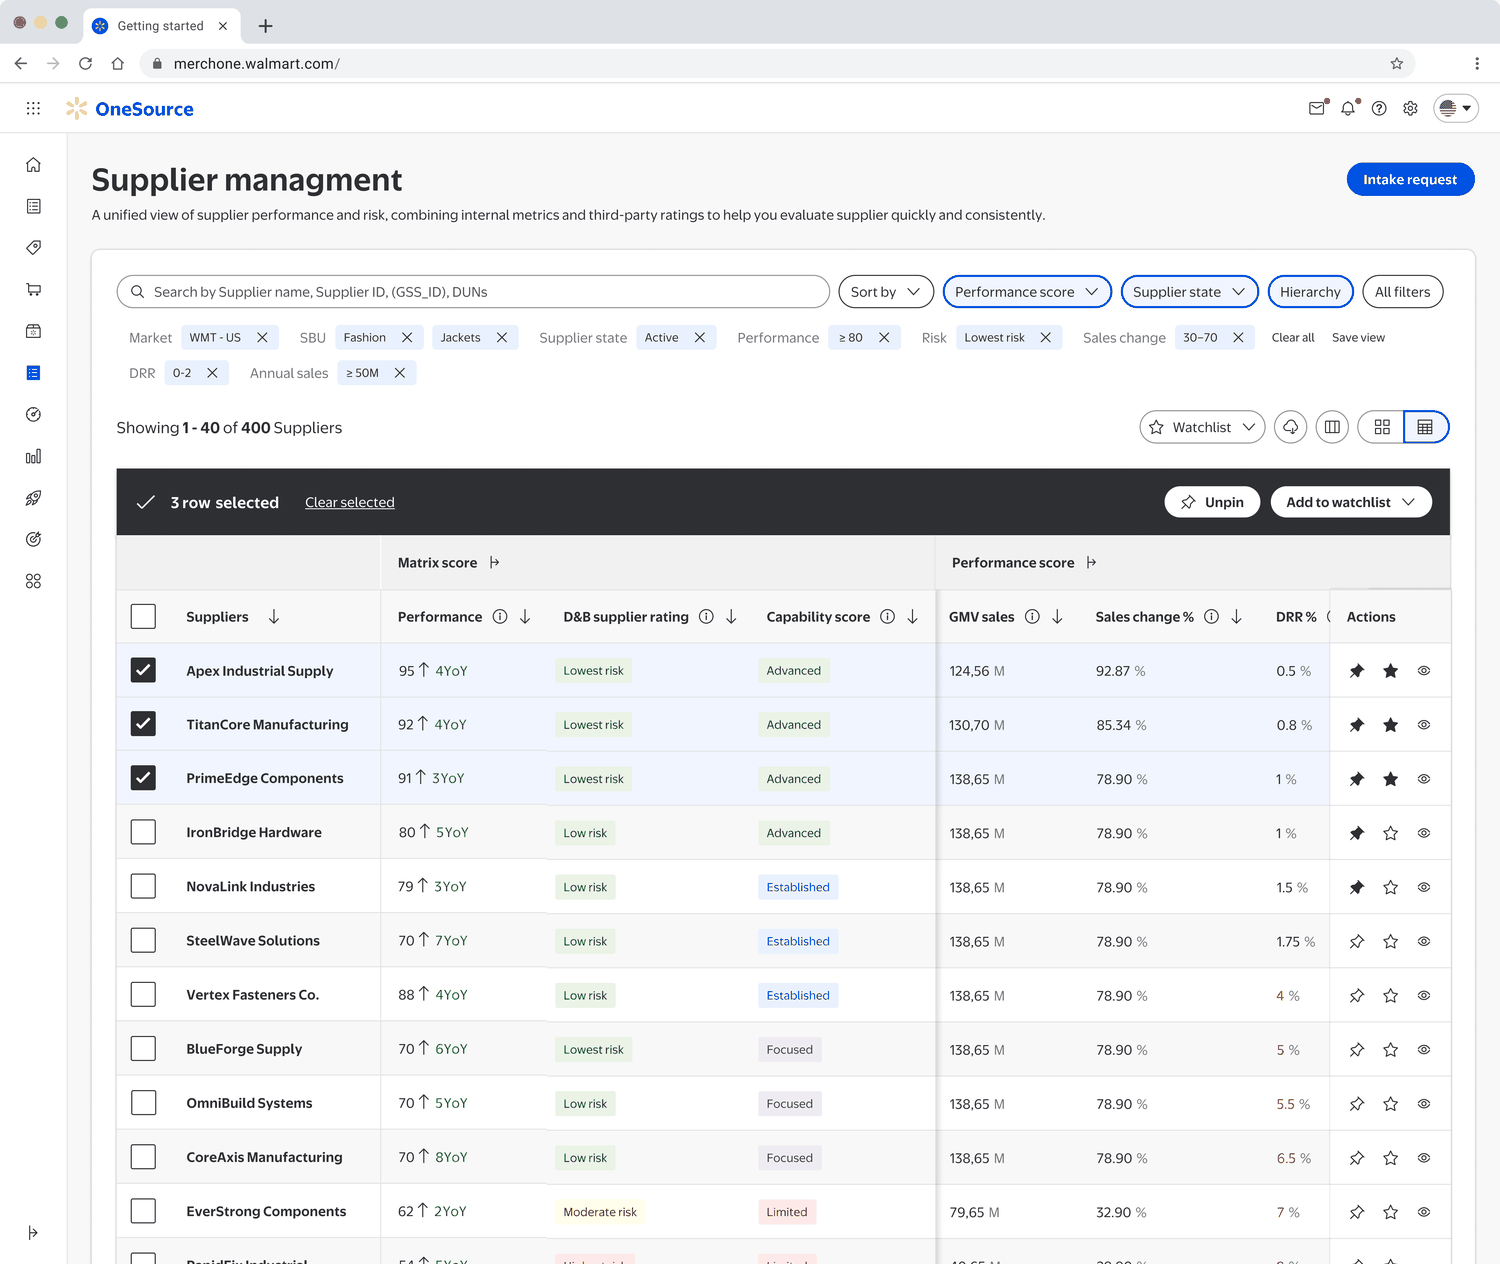
The details that make the decision model trustworthy, not just visible.
Fourteen moments from the shipped product — discovery, explainability, monitoring and the calculations underneath every score.
Save suppliers to watchlists
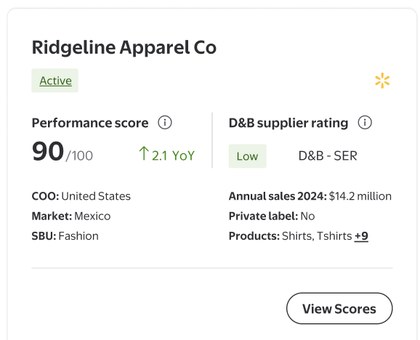
Every supplier card supports pinning and adding to named watchlists — like “Top performers” or “Q2 priority fashion” — so a shortlist survives past a single session.
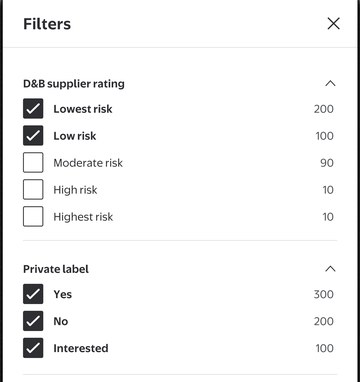
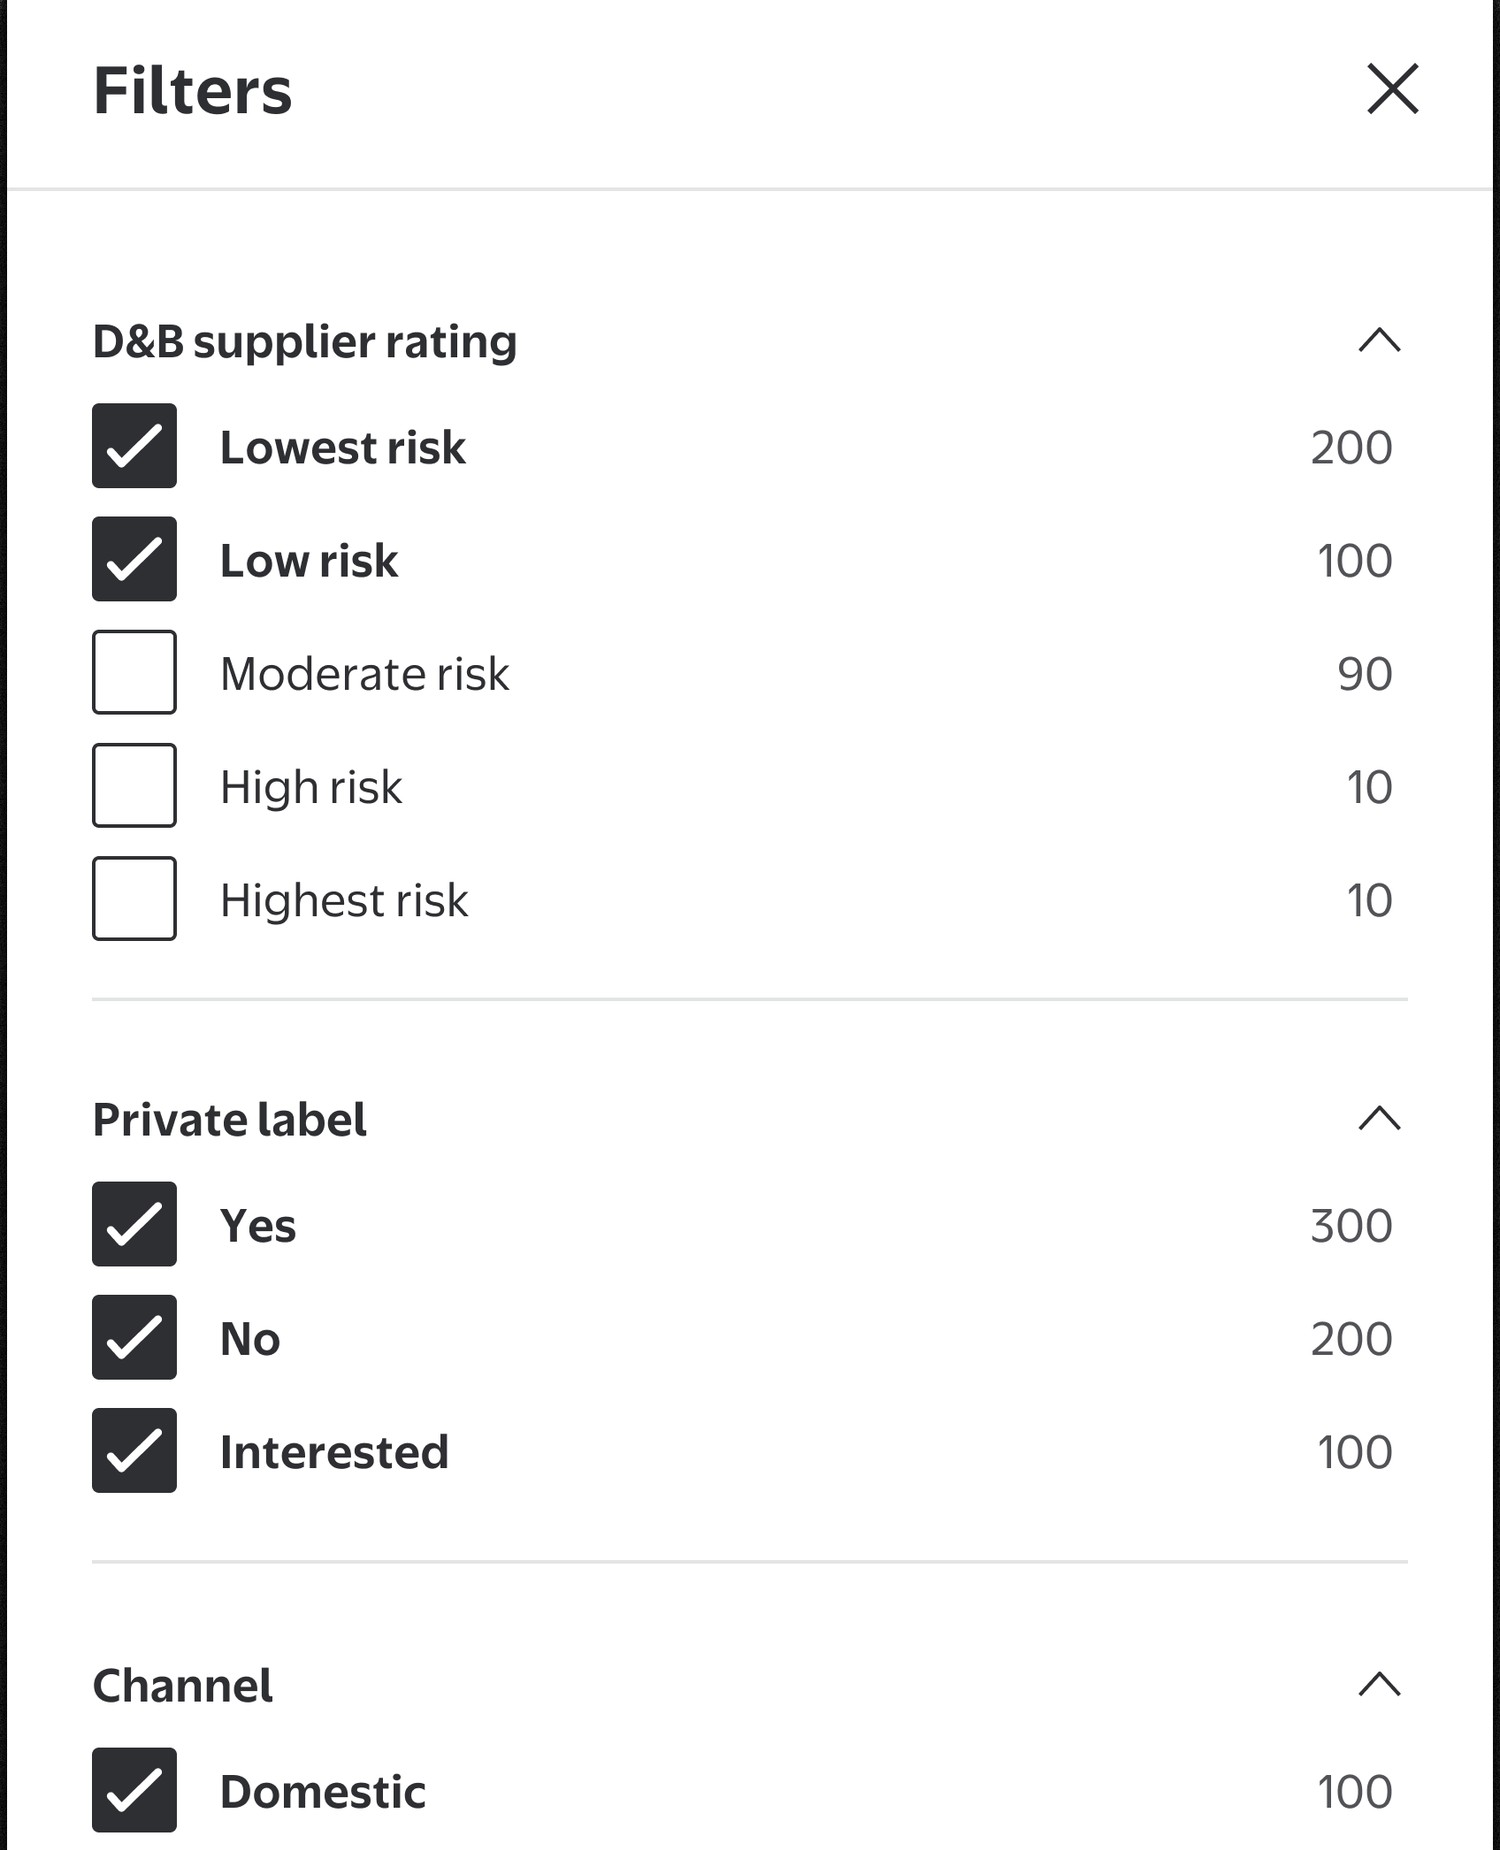
Filter across risk, market and origin
Filters cover D&B risk band, private label status, channel, market and country of origin, each showing a live result count before it's applied.
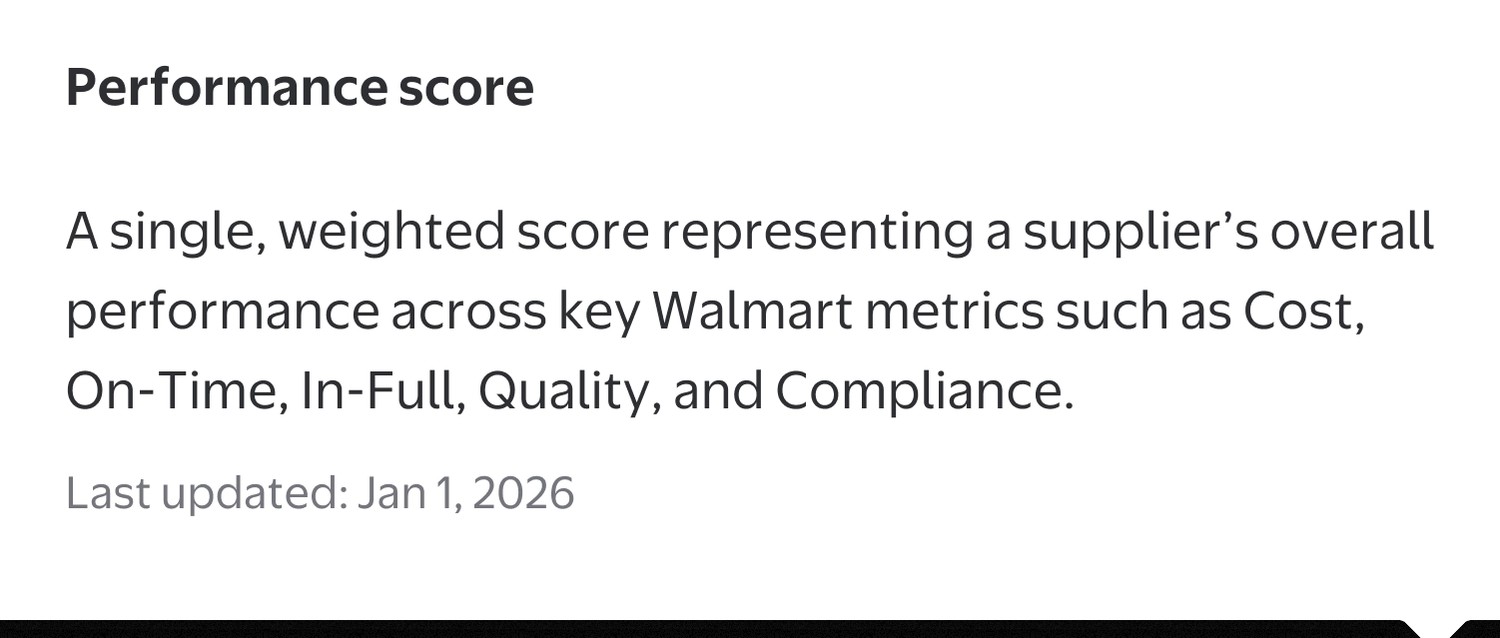
Explain what a score means
Every score carries its own definition, last-updated date and rating scale, so a number is never presented without the context to interpret it.
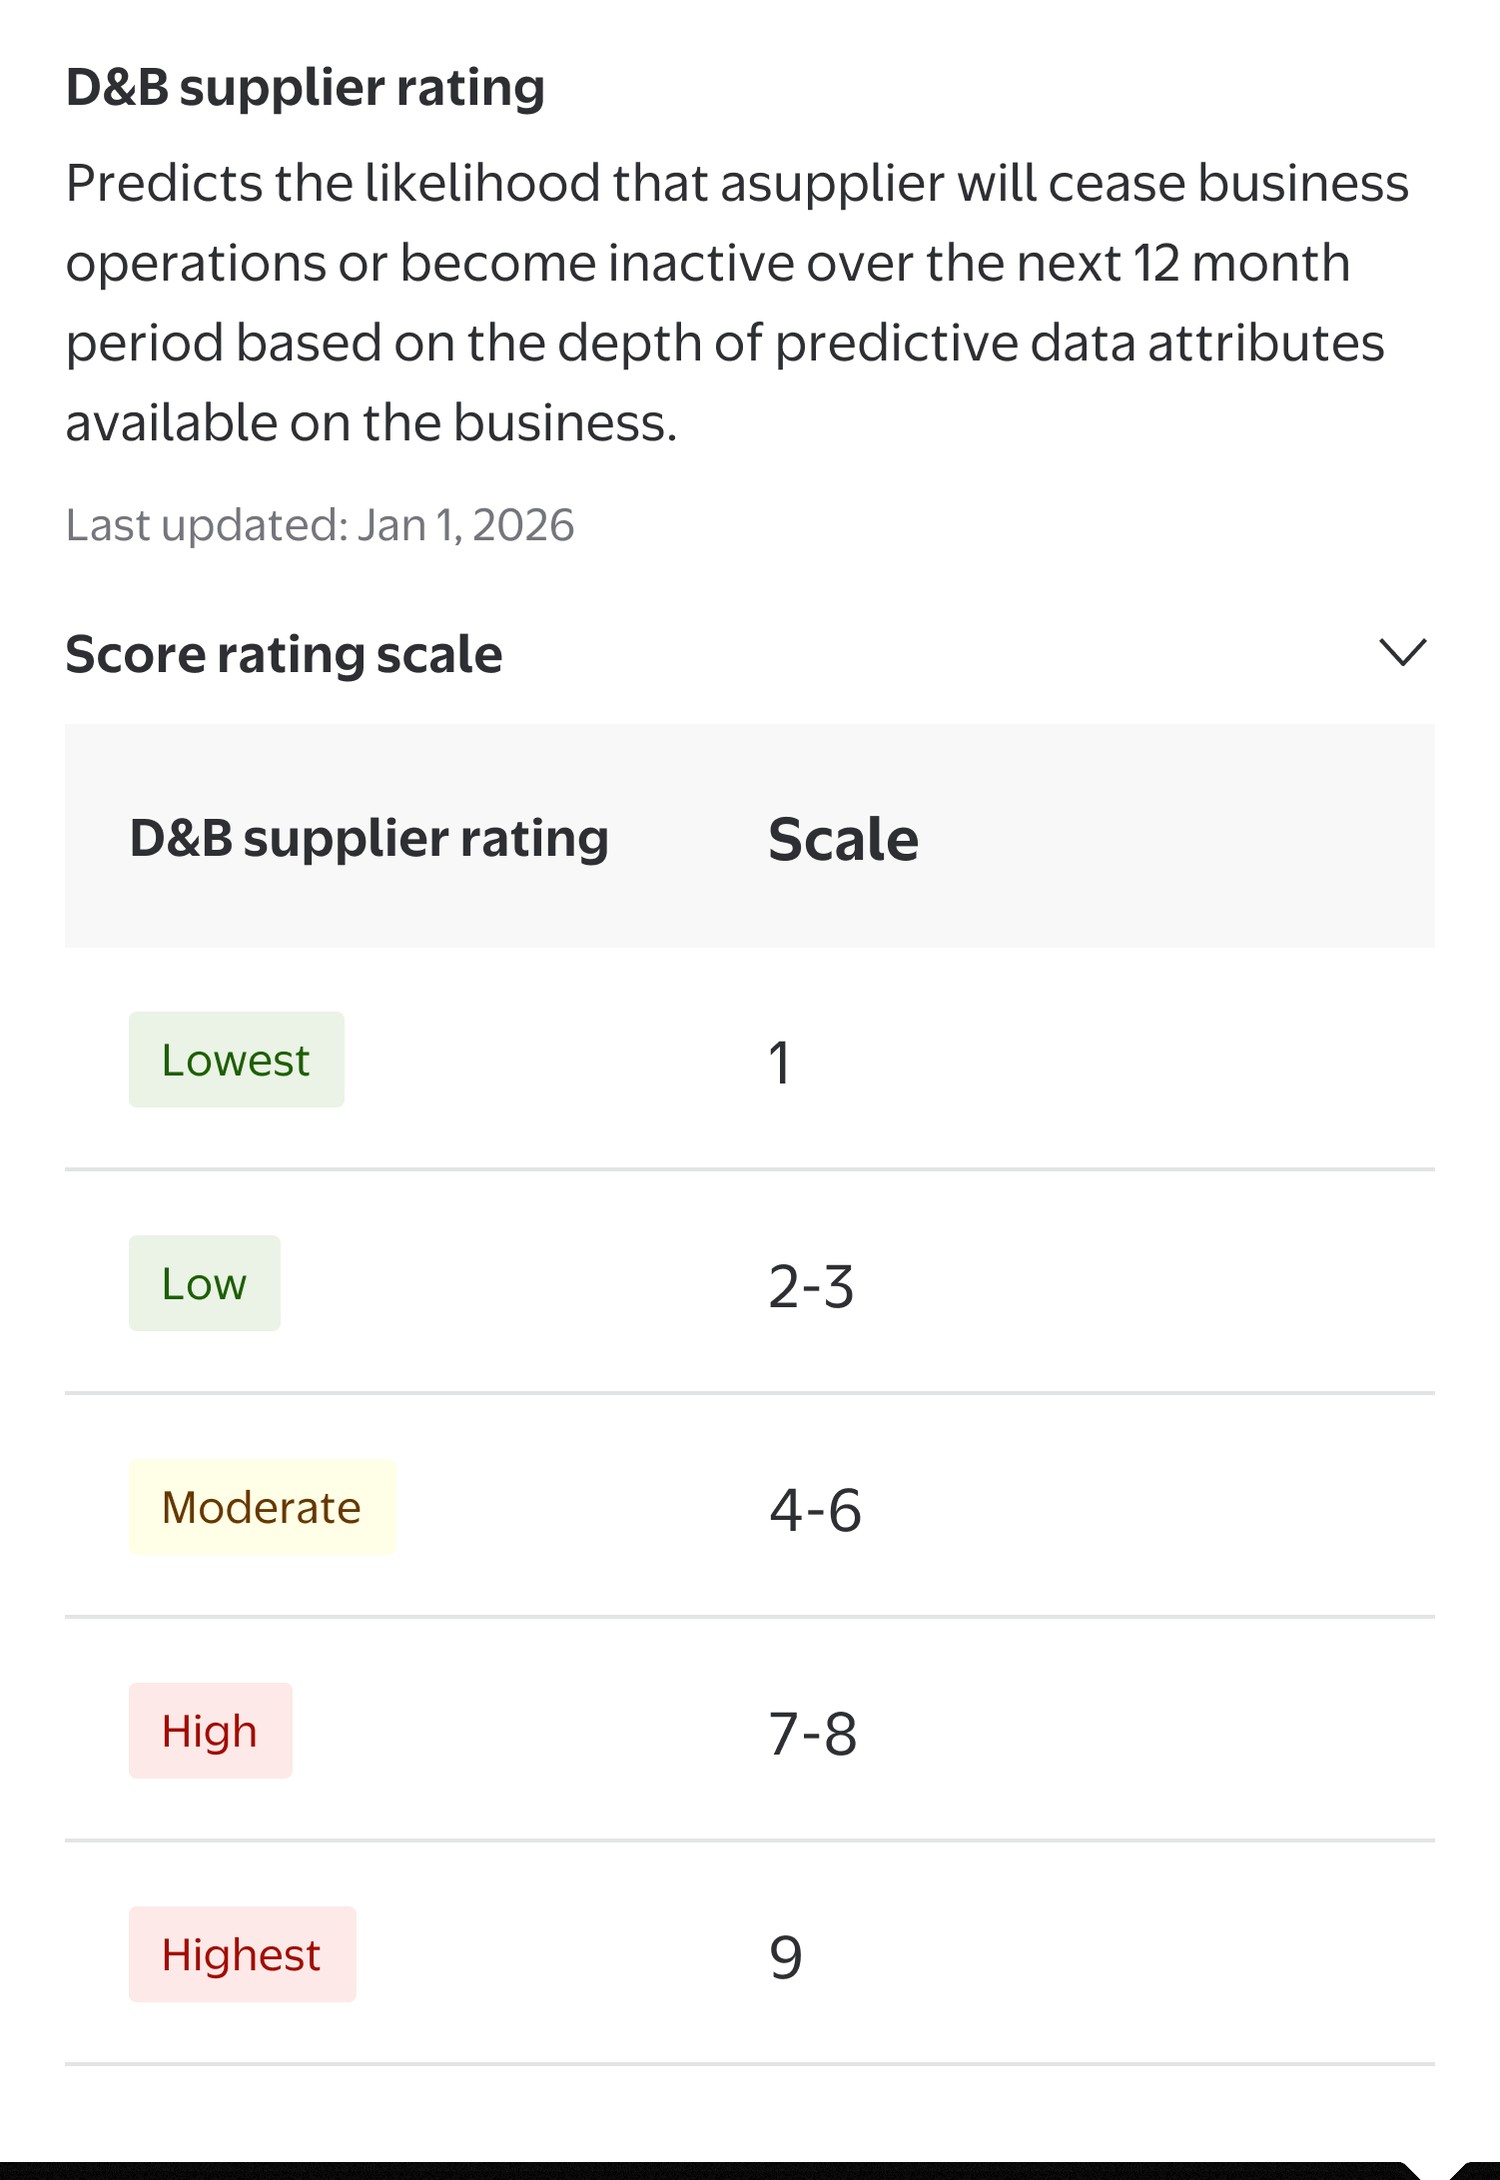
Same pattern for D&B rating
The D&B supplier rating gets the identical explainability treatment — definition, scale and freshness — reinforcing one consistent pattern across every metric.
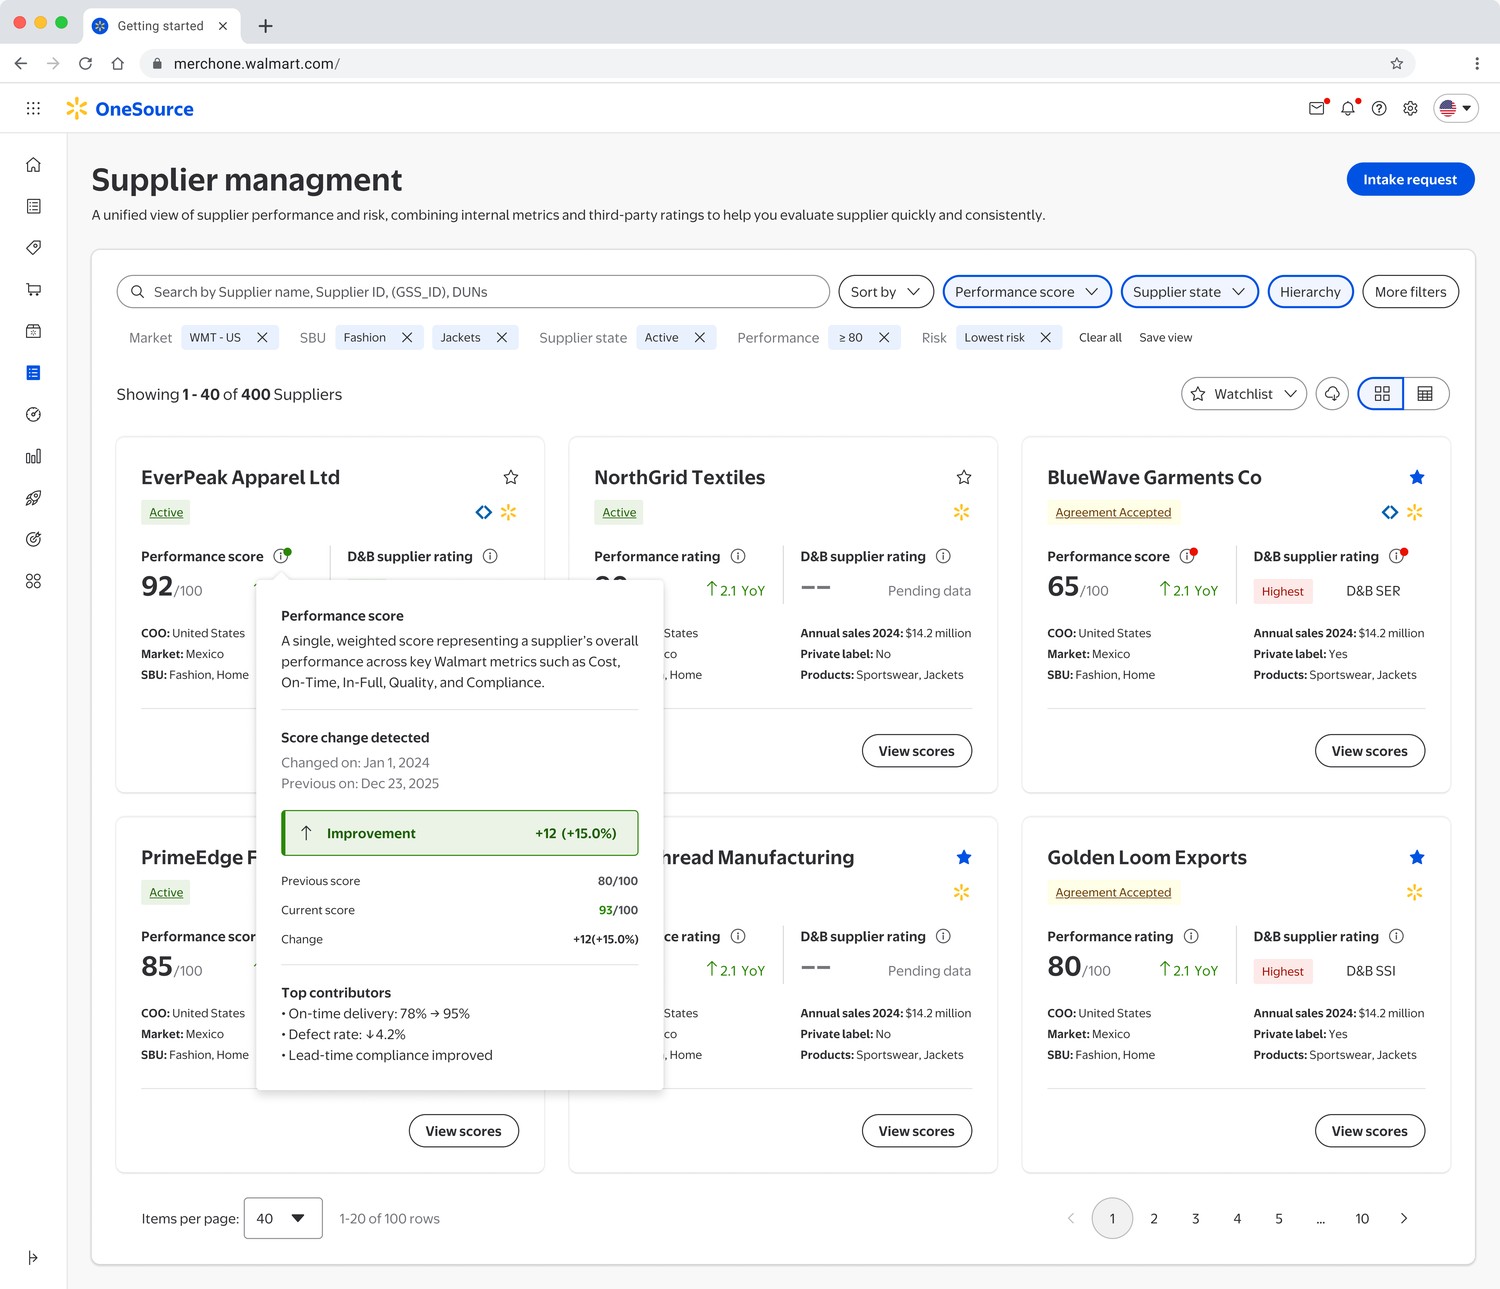
Surface what improved
When a score changes, the card explains why: previous vs. current value, the delta, and the top contributors behind the move.
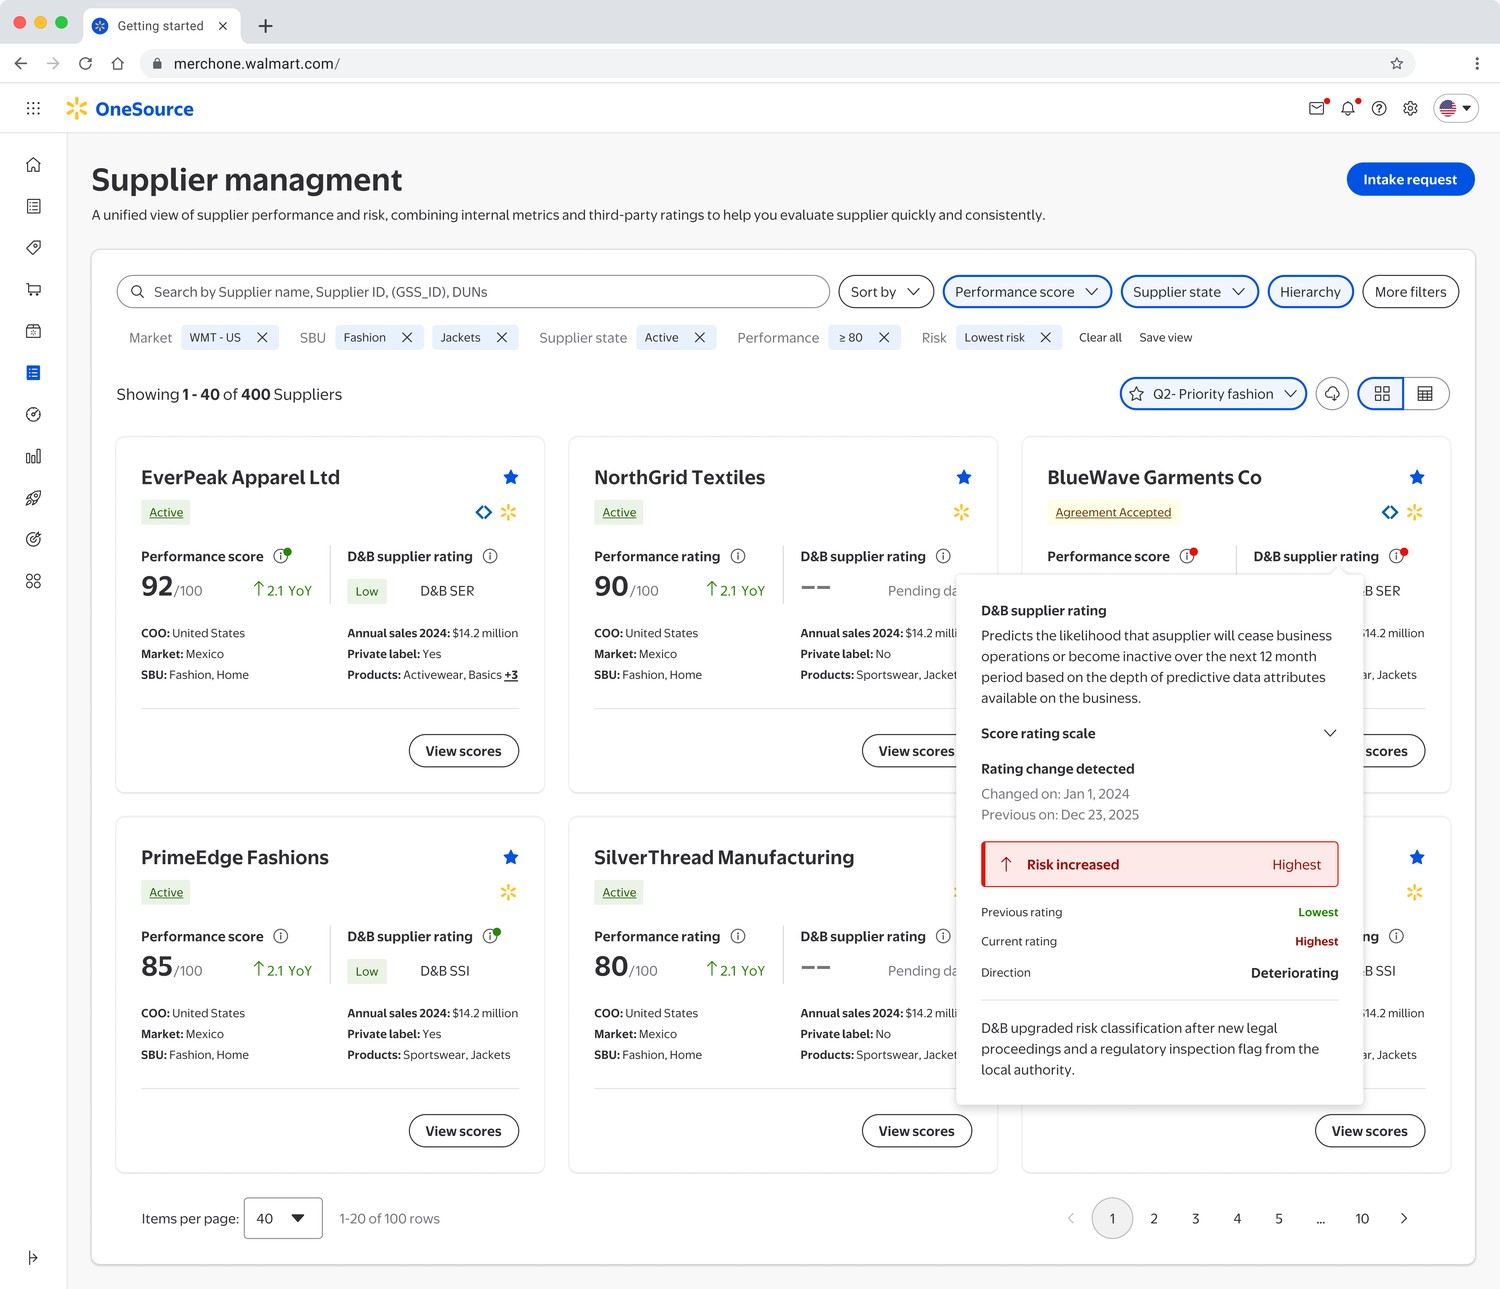
Flag deteriorating risk early
The same change-detection pattern applies to risk. A D&B rating that moves the wrong direction is called out immediately, with the reason attached.
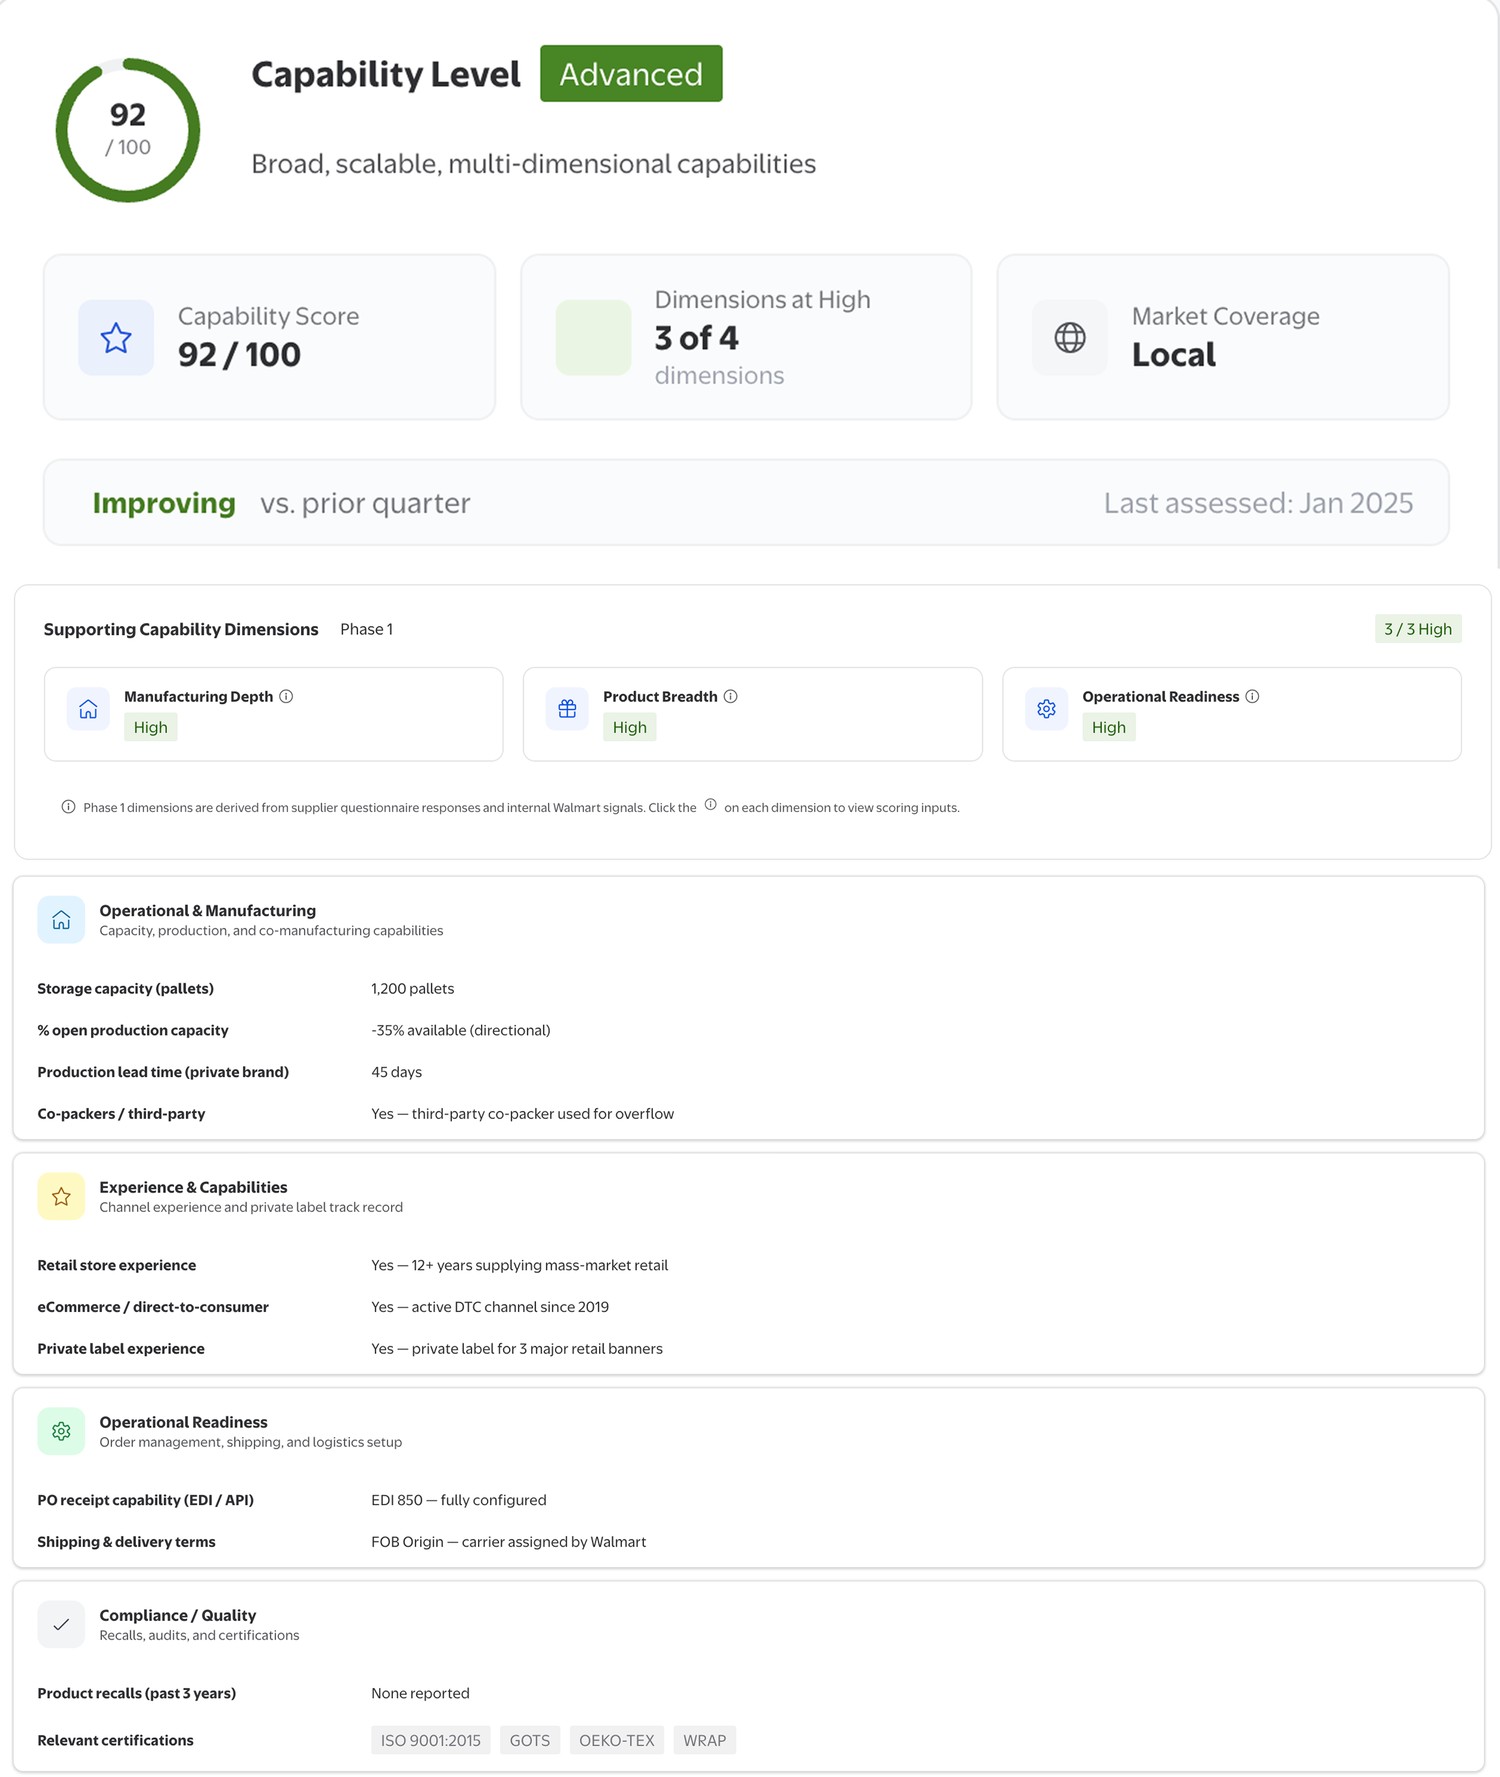
Capability, broken into dimensions
Capability is not one opaque score — it's manufacturing depth, product breadth and operational readiness, each independently rated and explained.
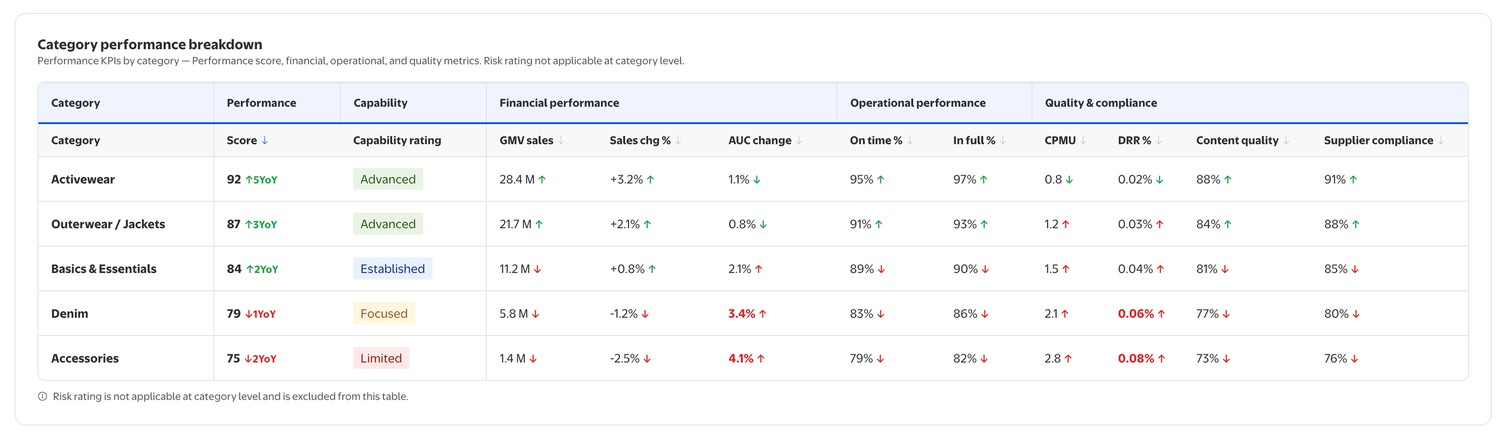
Performance at the category level
The same supplier can perform differently by category. This view breaks financial, operational and quality metrics down category by category.
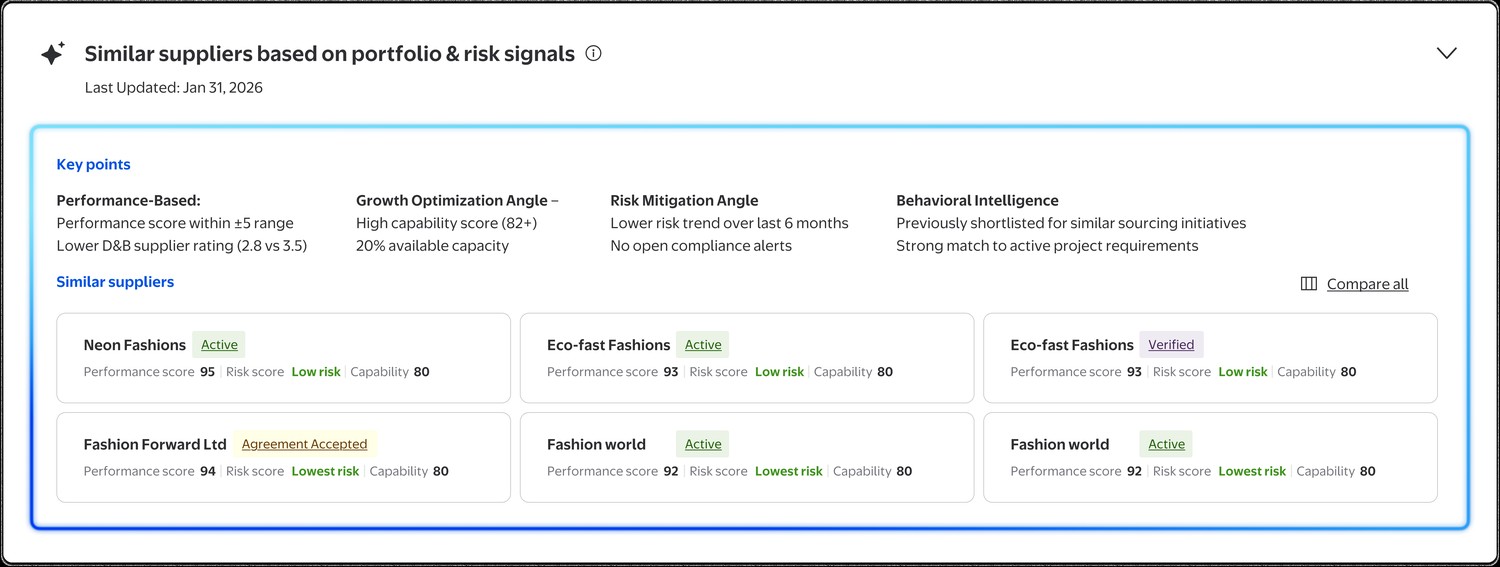
AI-suggested similar suppliers
When a supplier doesn't fit, the system proposes comparable options using portfolio and risk signals — with the reasoning shown alongside each match.
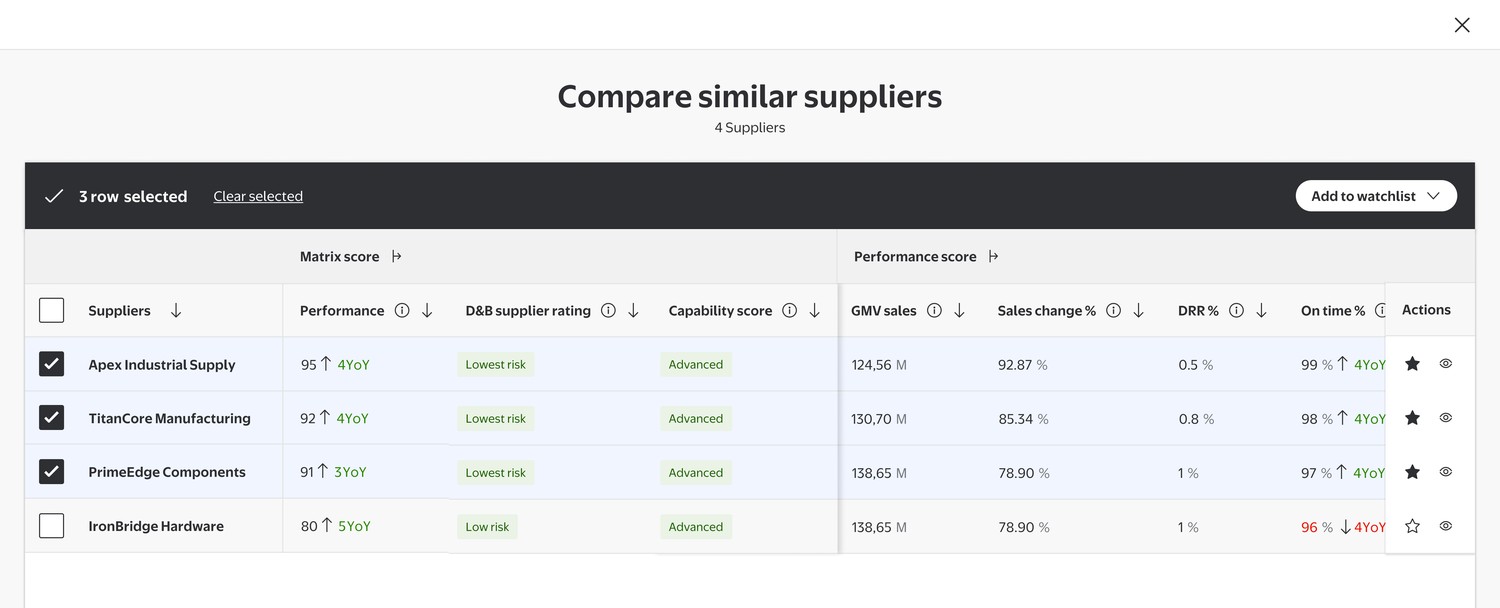
Compare matches, then shortlist them
"Compare all" opens the suggested suppliers side by side against the same score columns as the main list, so the comparison is apples-to-apples — then the selected rows go straight to a watchlist.
Calculations, not just numbers
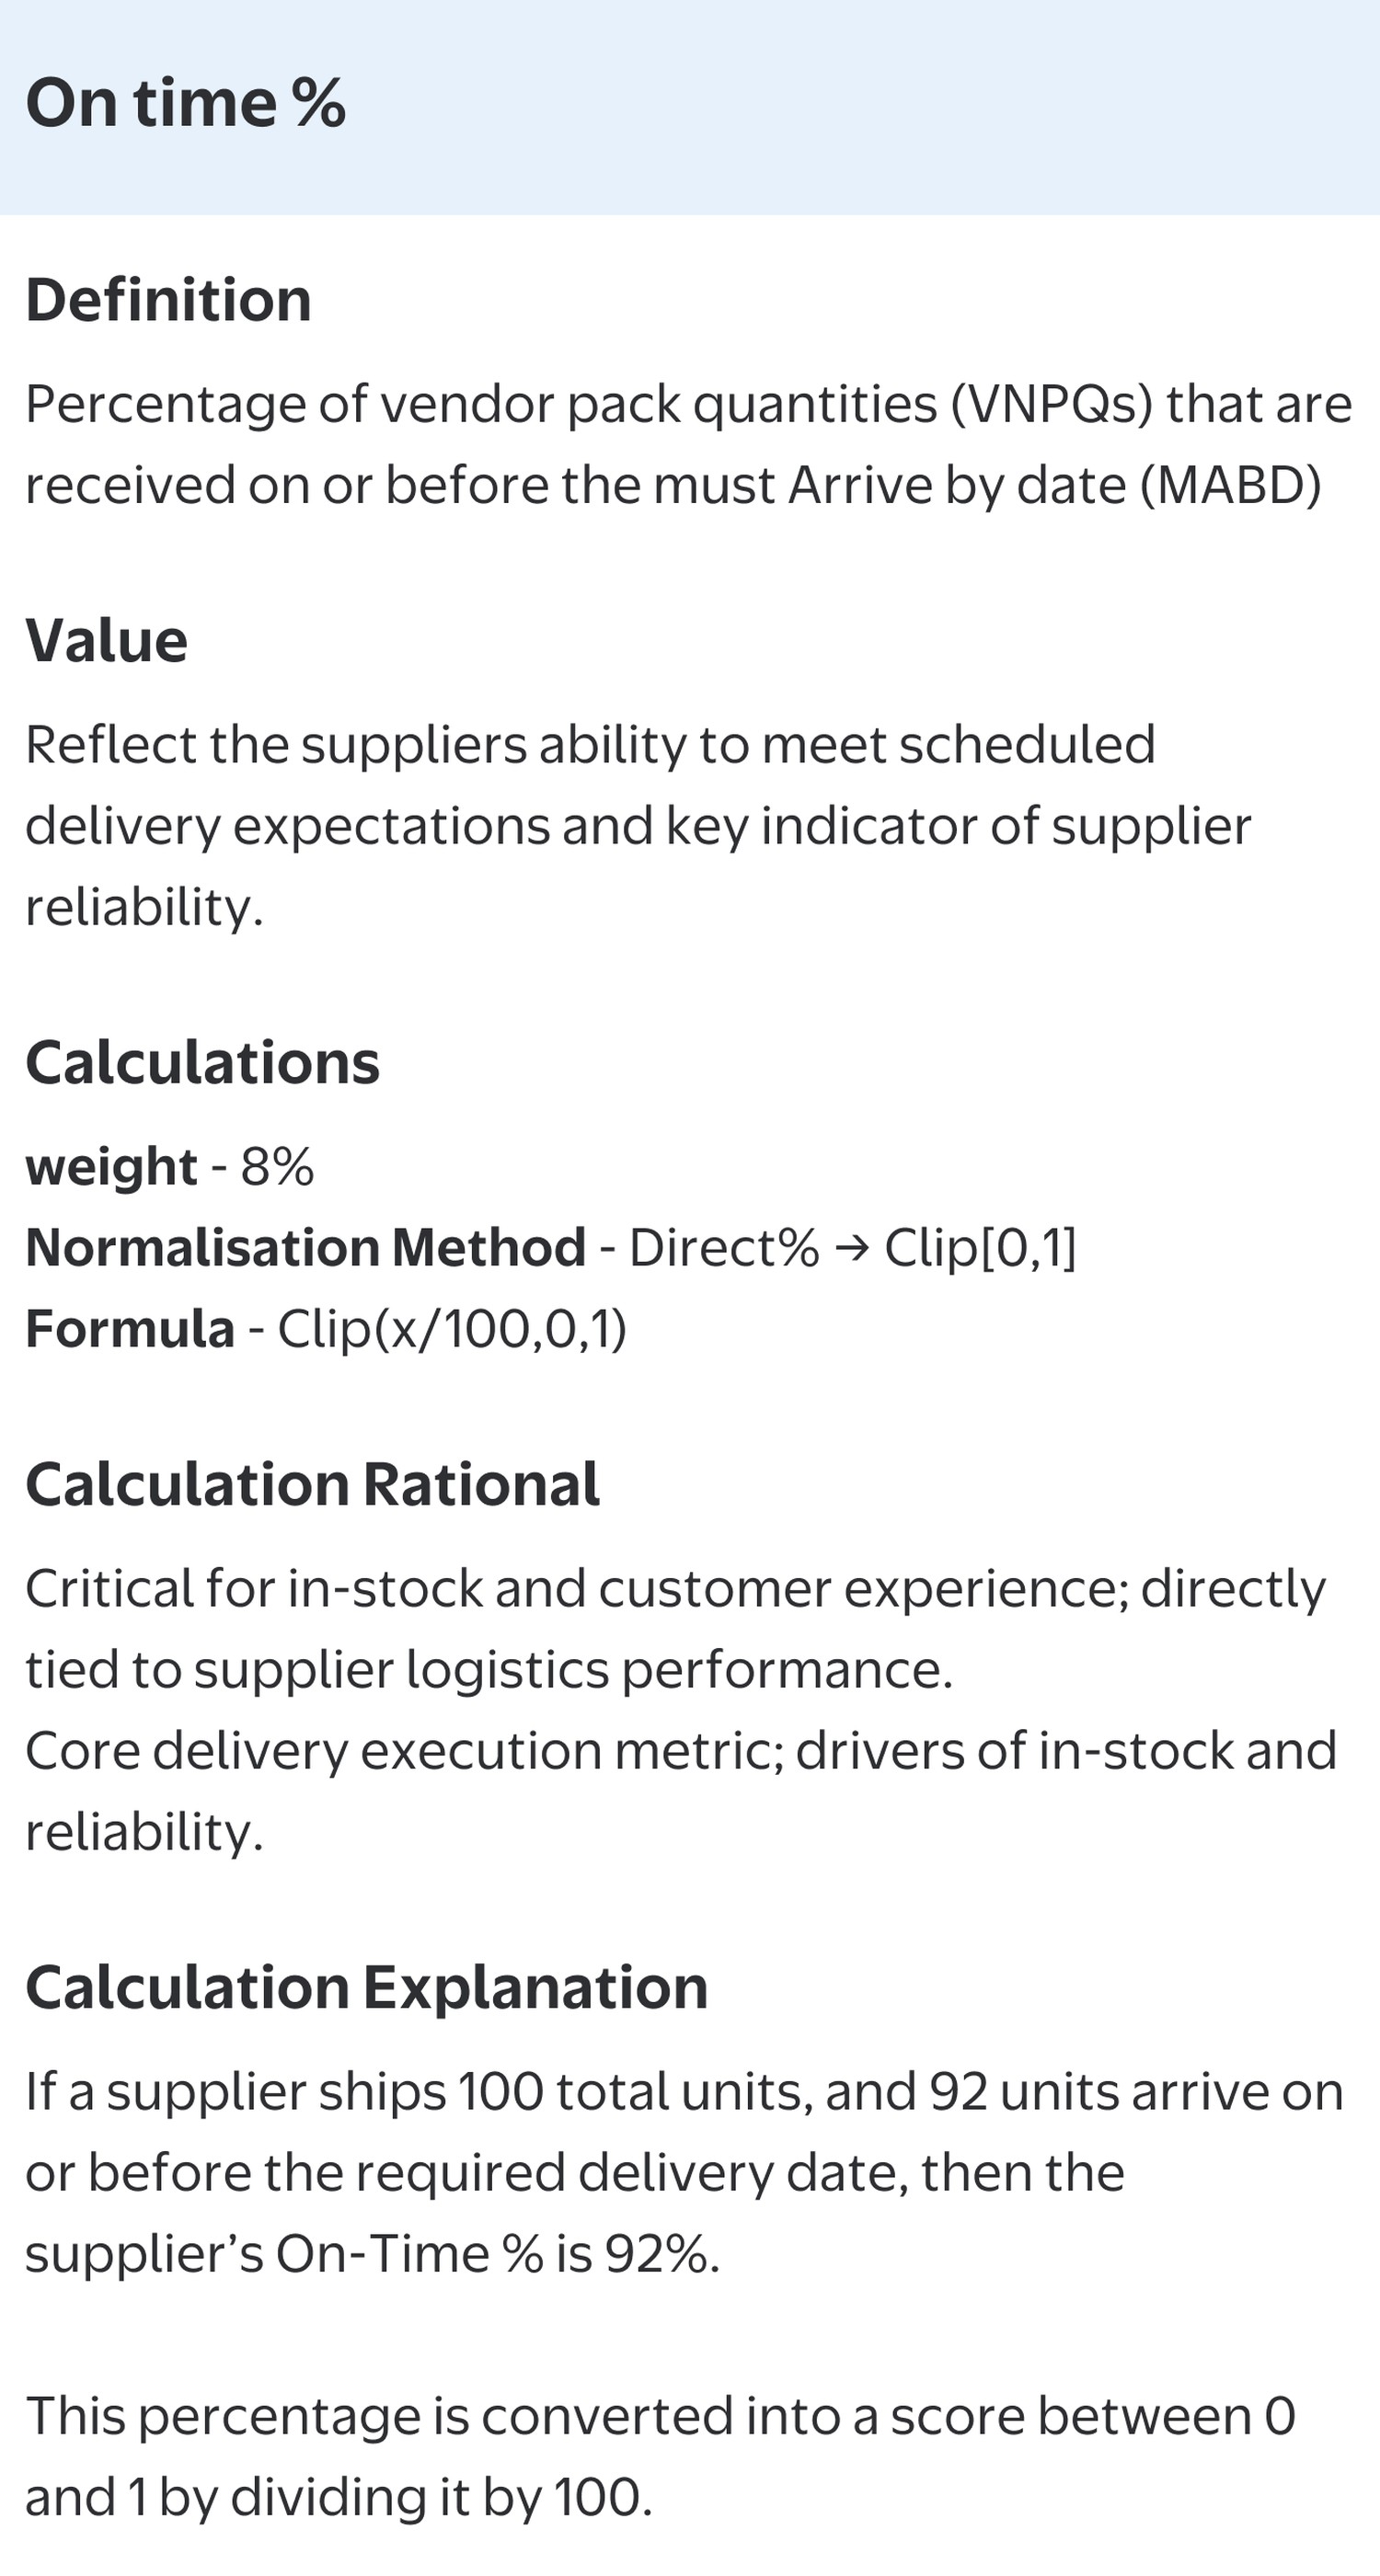
Every metric can be expanded into its full definition — formula, weighting and a worked example — for teams who need to audit, not just trust, the score.
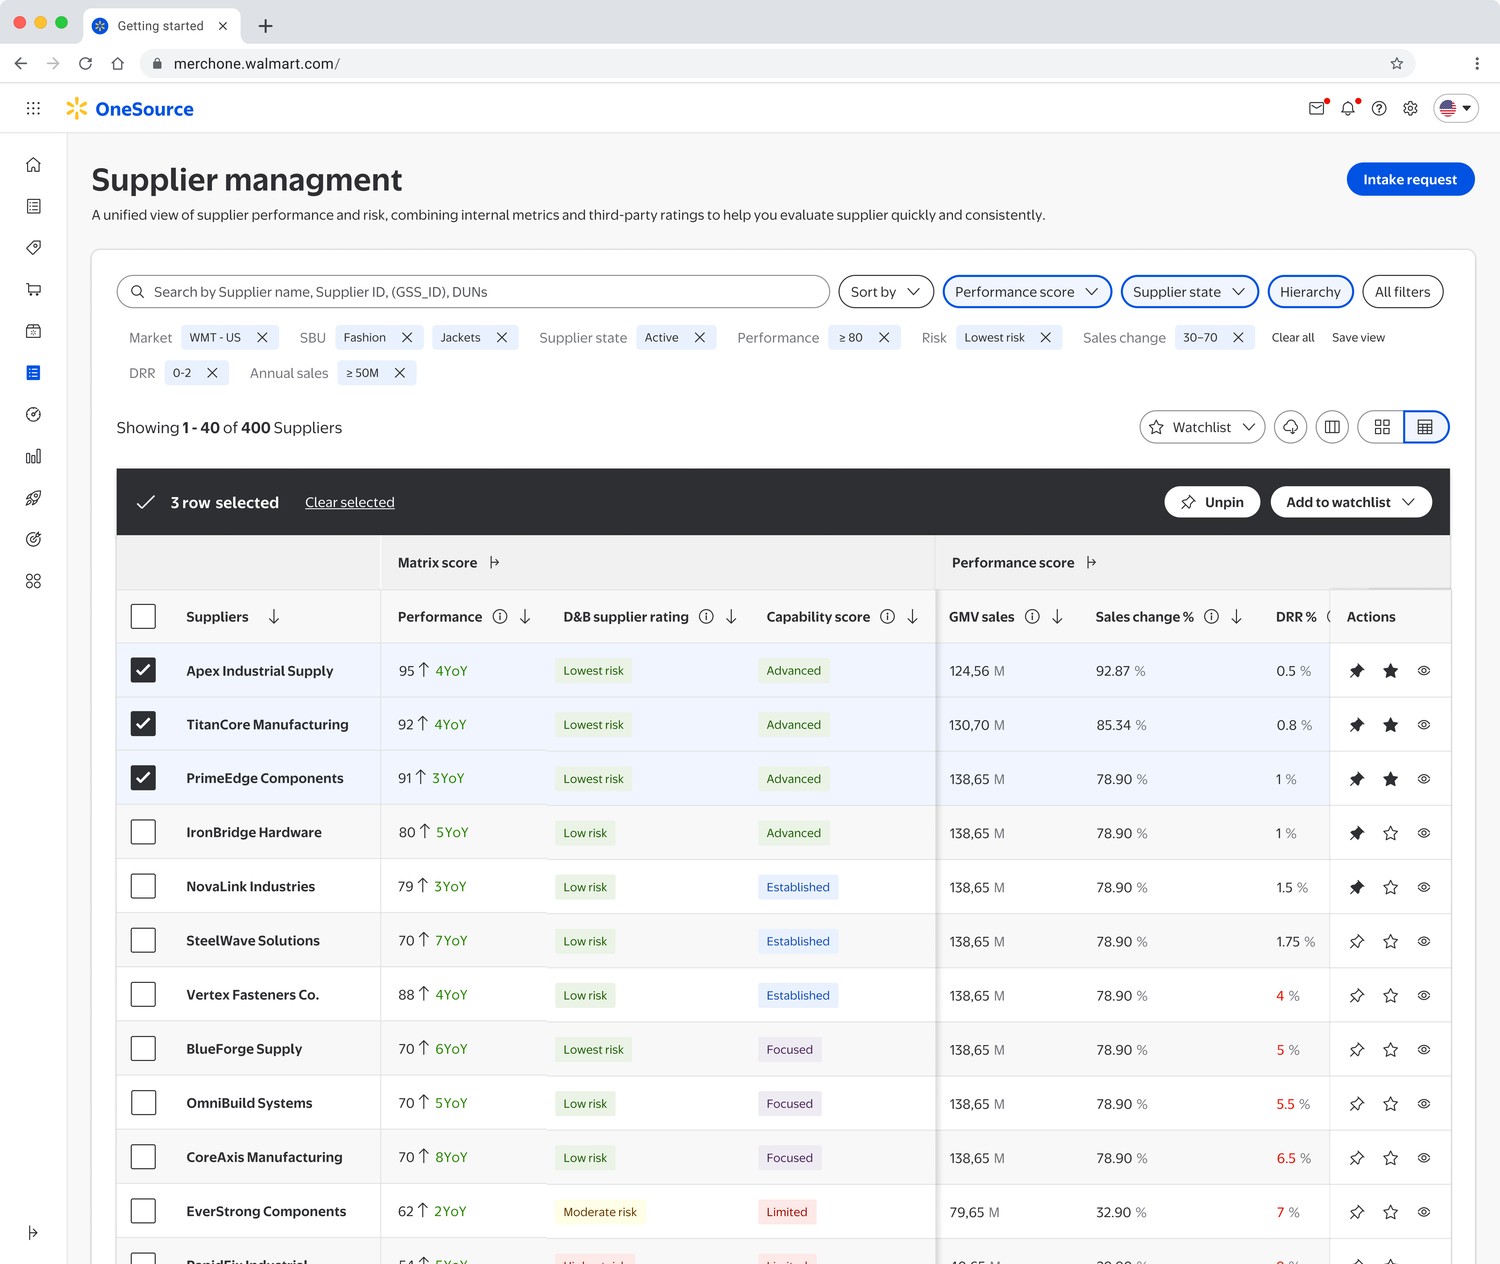
Select and compare across rows
The table view supports multi-row selection, so a sourcing manager can shortlist several suppliers side by side and act on them together — pin, star or add to a watchlist in one pass.
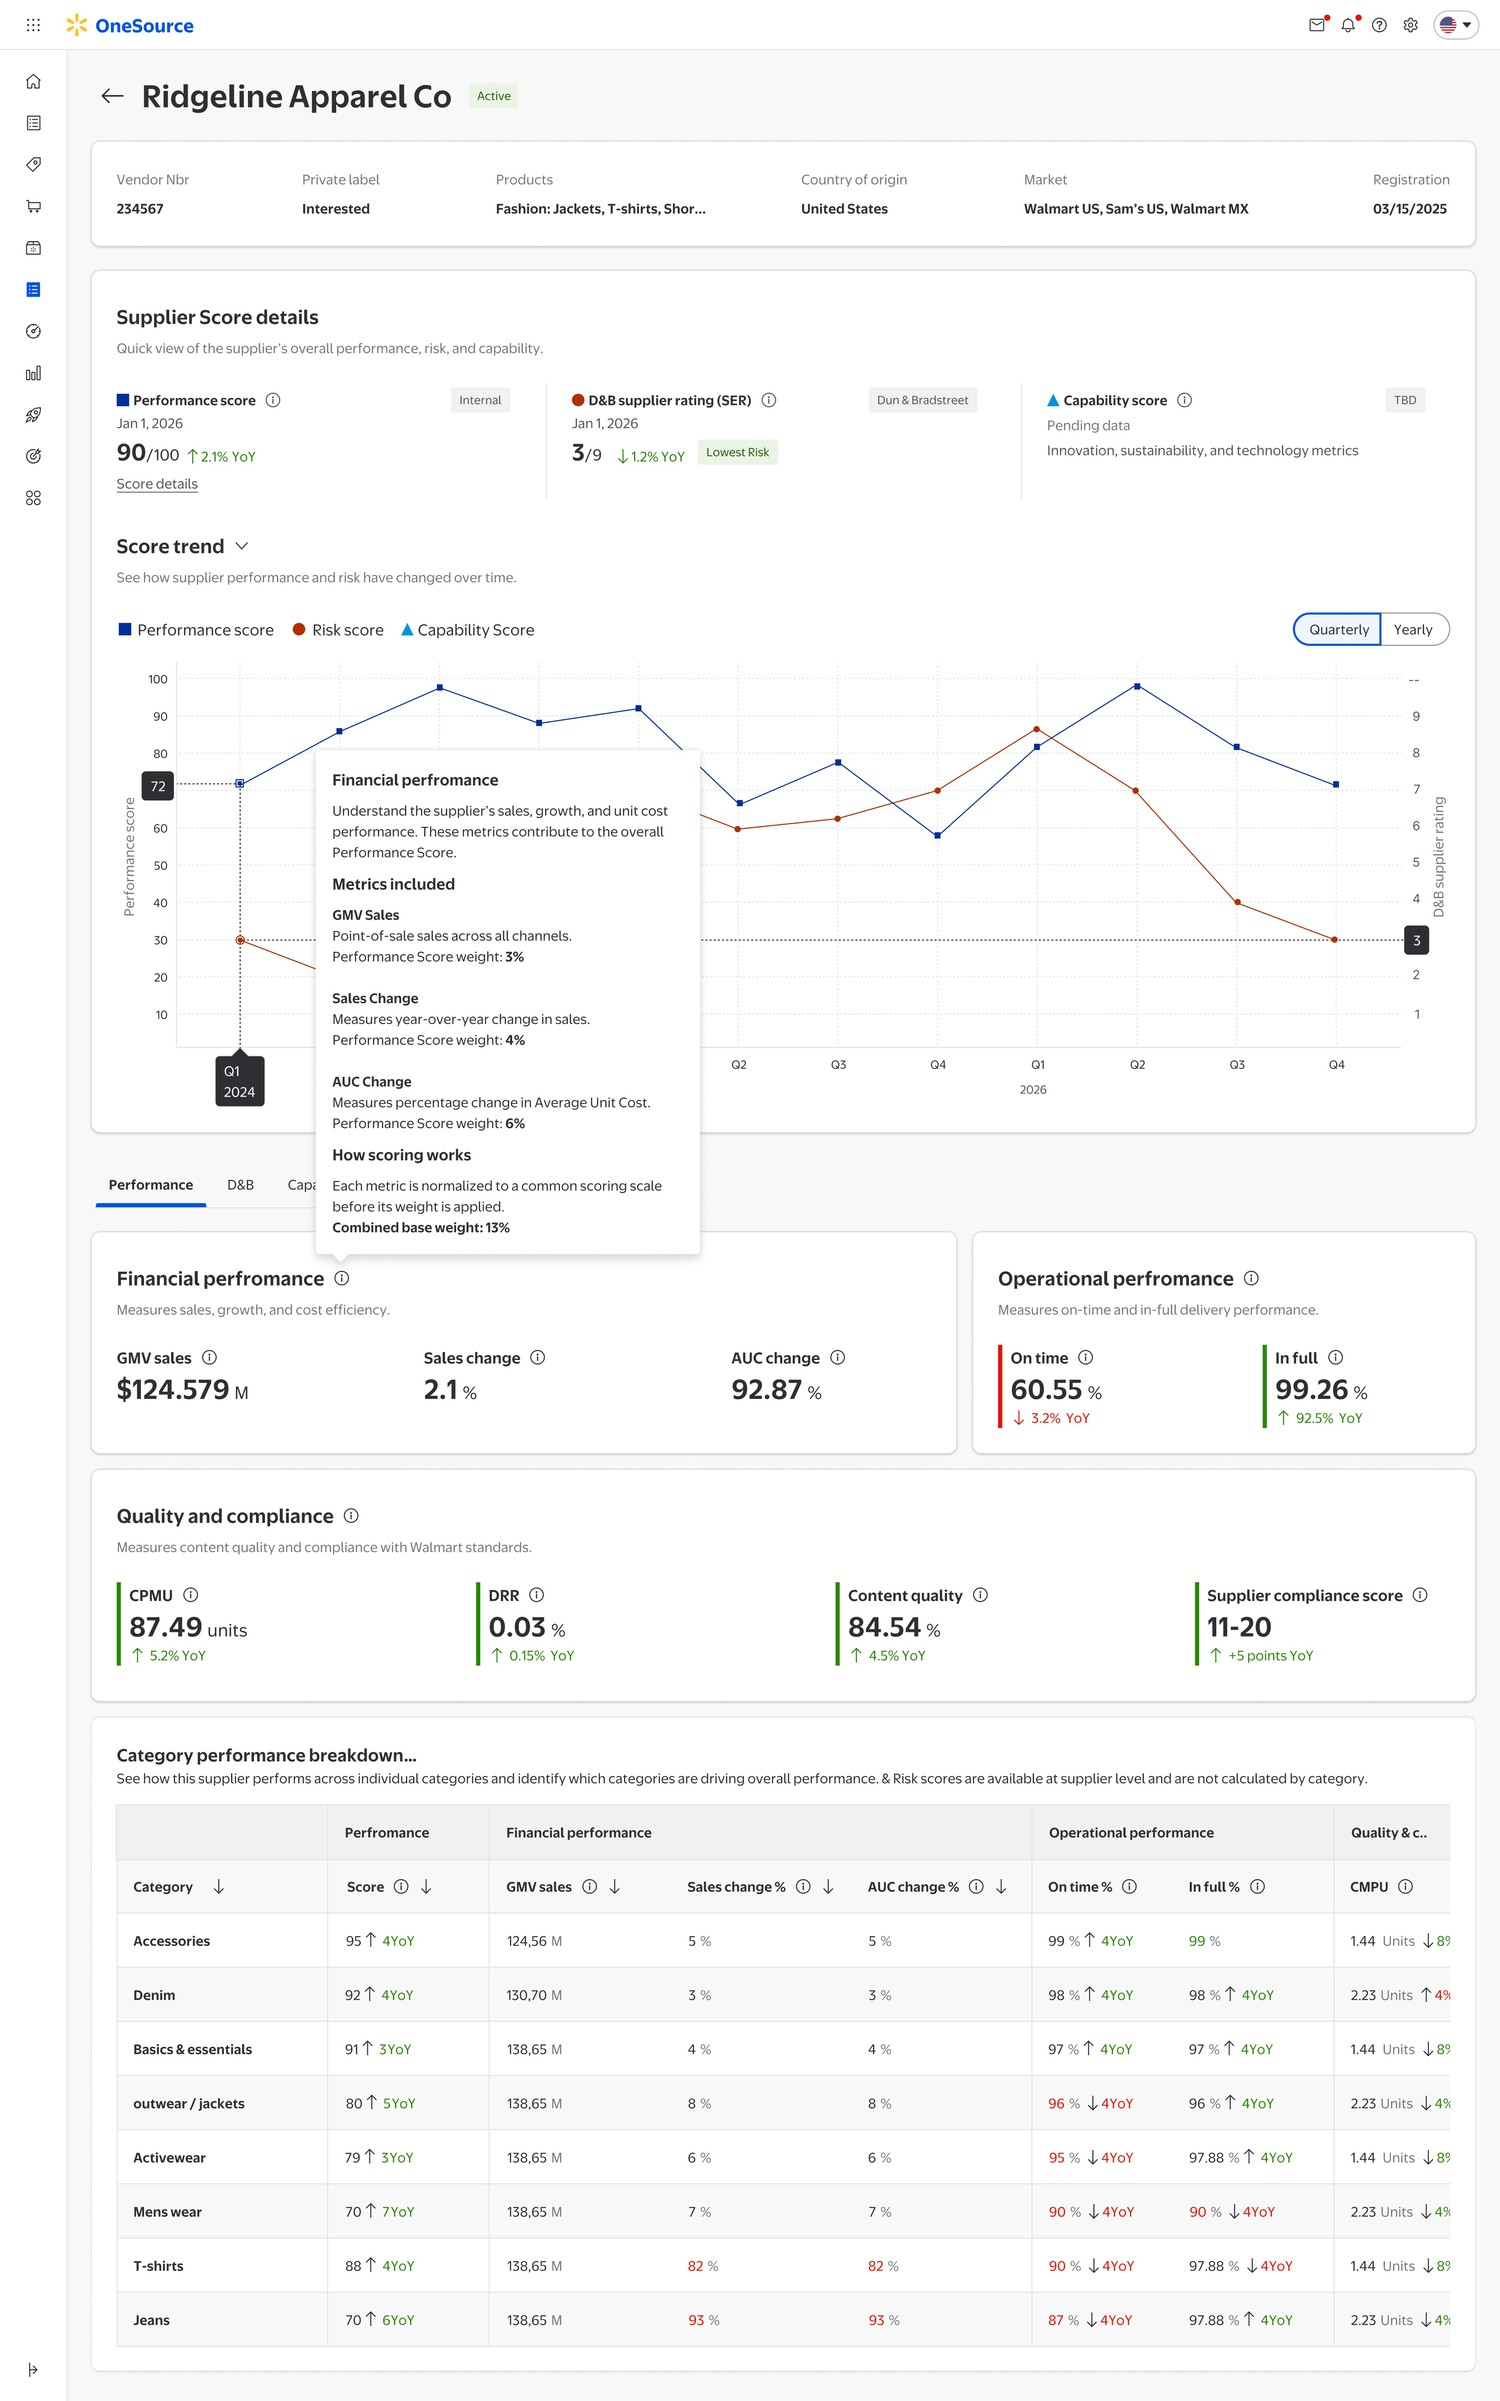
One supplier, every score, one page
The full supplier profile brings performance, D&B rating and capability into a single quarterly trend, with each metric's own definition available inline rather than in a separate report.
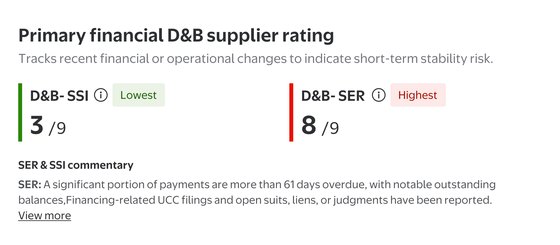
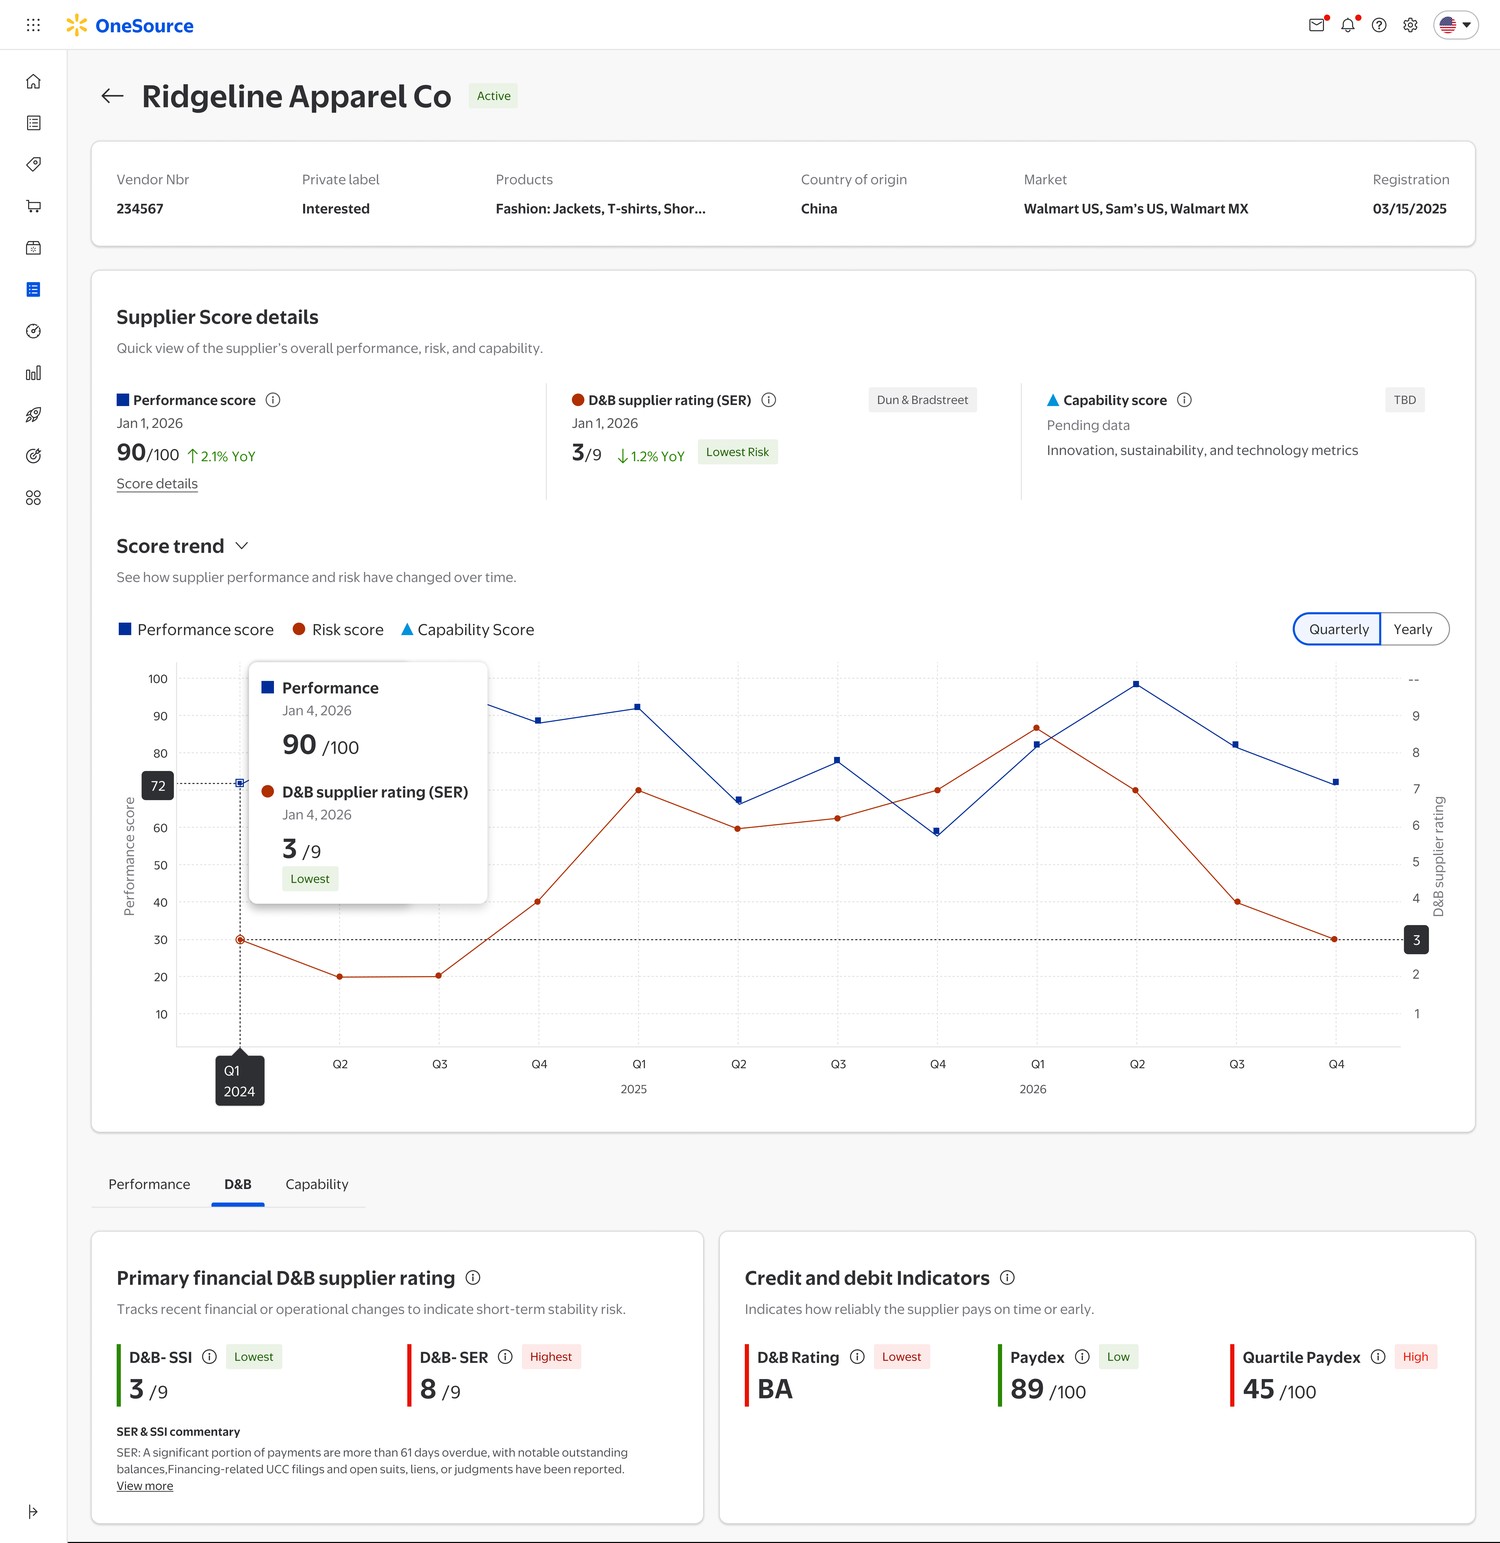
Risk, with the underlying signals
The same profile's D&B tab exposes the SSI, SER, Paydex and credit indicators feeding the rating — plus a plain-language commentary explaining why the risk classification changed.
Phase 1 shipped the core evaluation experience. Future direction expands intelligence.
Core evaluation
Trusted supplier intelligence
Not yet achieved outcomes—targets for what comes next.
The interface became simpler only after the decision model became clearer.
AI helped the team move from early concepts to tangible directions faster—not replace design judgment.
SMEs translated JTBDs into descriptive prompts so the team could explore future-state directions quickly. I used the outputs to compare possibilities, challenge assumptions and identify directions worth developing—not as final design.
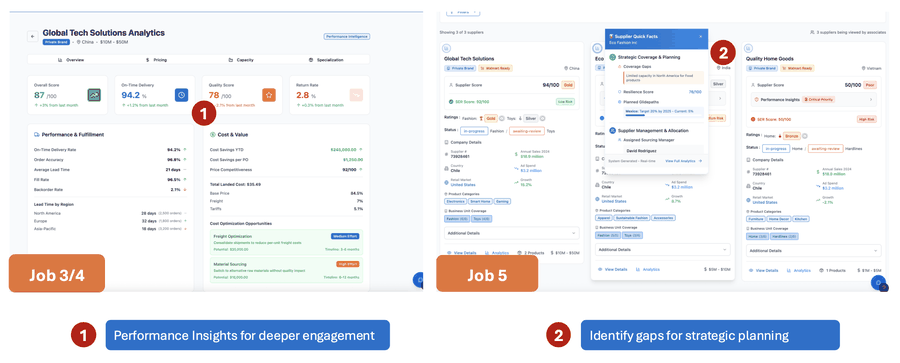
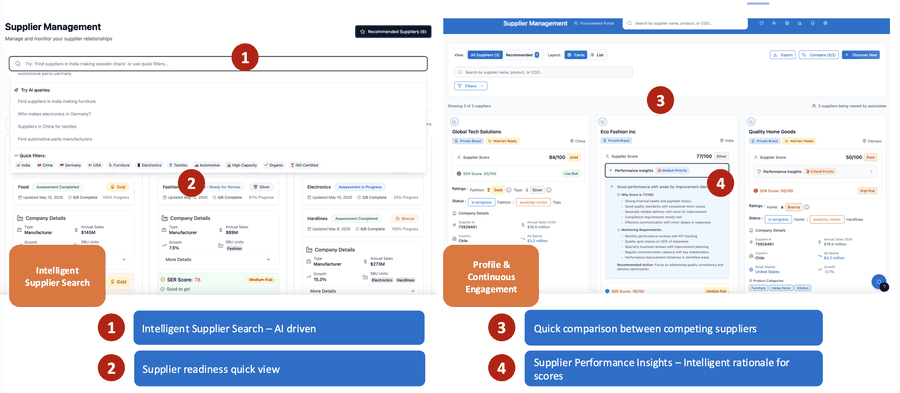
A clearer supplier decision experience emerged from the work: centralized context, structured evaluation, evidence behind scores, and a path from discovery to ongoing intelligence.
"Complexity didn't disappear. It became structured enough to support a decision."
Delivery planning became a decision system for D&D.
Making shipment deadlines, D&D exposure and planning priority visible in the workflow where Customer Service Agents already make delivery decisions.
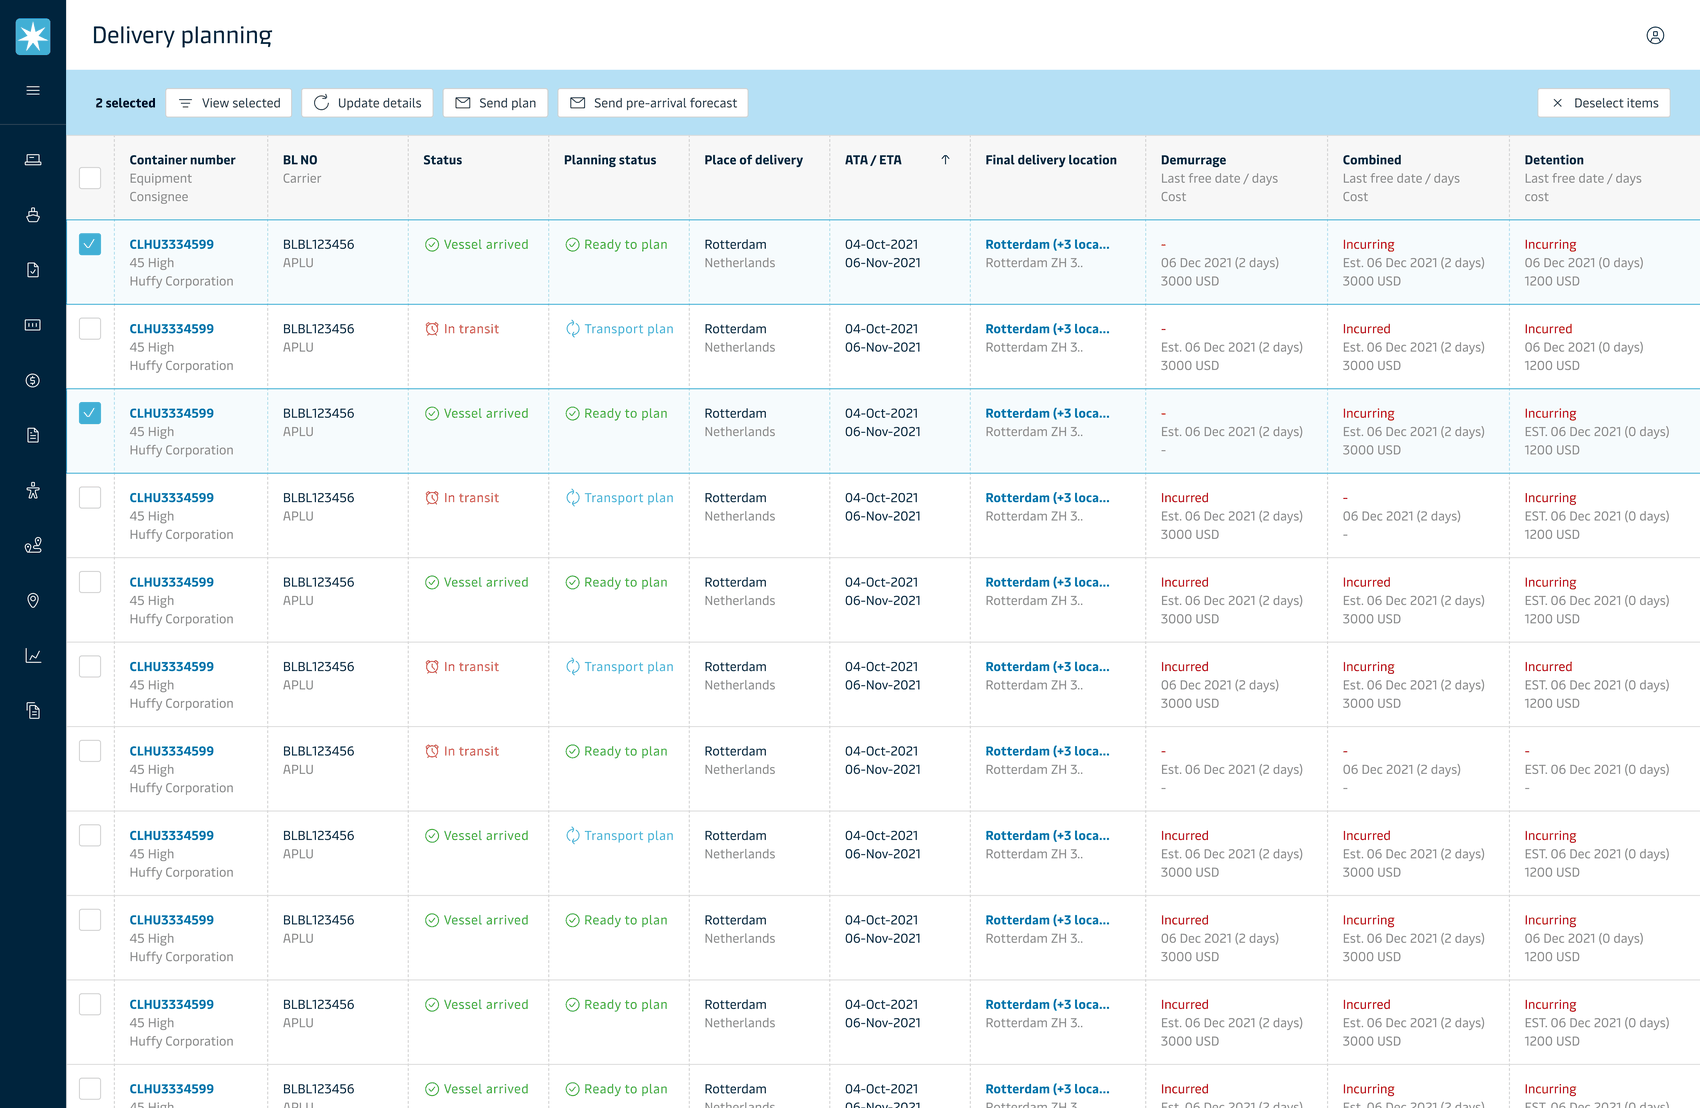
One decision: prioritize the equipment where D&D cost can be avoided.
Detect
Know whether D&D applies and when free time is ending.
Prioritize
See which shipments are at risk or already incurring cost.
Plan
Use D&D exposure as a signal to start or adjust delivery planning.
Explain
Capture Reason Code and Responsible Party for incurred cost.
Communicate
Give customers the reason, number of days and applicable cost.
Control
Carry D&D context into alerts, reporting and container visibility.
Fragmented D&D information made cost harder to act on.
Customer Service Agents had to combine contract terms, shipment milestones and spreadsheet calculations to understand D&D exposure and decide which shipments needed attention.
Manual D&D calculations
Contracts, shipment milestones and cost formulas were maintained across Excel and reports.
One D&D view
Bring applicable D&D information into the shipment view.
Milestones drive the cost
Arrival, Gate Out and Empty Return determine D&D days and charges.
One visible deadline
Show Last Free Date, days and D&D status together.
Cost without priority
Users could calculate incurred cost but lacked a clear way to prioritize shipments before cost increased.
Cost → priority
Surface At Risk and Incurring states so the CSA knows what needs attention first.
Reason hidden after the charge
Reason Codes and responsibility were maintained manually after D&D was incurred.
Cost → reason → action
Connect D&D cost to Reason Code, Responsible Party and Root Cause Analysis.
I translated a complex operational requirement into a planning experience.
Connected research to the problem
Synthesized CSA interviews, usability findings and business requirements to identify where D&D was affecting delivery decisions.
Defined the decision model
Prioritized Last Free Date, D&D state, cost, milestone, reason and action as the core planning signals.
Shaped the workflow
Translated the requirements into list visibility, prioritization, alerts and root-cause pathways.
Refined with users
Used usability feedback to clarify hierarchy, reduce information hunting and strengthen the planning workflow.
Research showed that changing shipment information was already a planning burden for CSAs.
"ETAs change daily. Keeping track of the changes is the most time-consuming activity."
4–6 systems were searched for ETA / vessel information, and some users spent up to 5 hours a week validating incoming-container ETAs. 90% of customer communication happened via homemade Excel sheets shared through SharePoint or email.
"All communication with customers happen via Excel sheets…"
Excel had become part of the operational workflow for customer communication and D&D tracking, reinforcing the need to move the decision into the product workflow rather than create another report.
CSA needs depend on the task at hand and the customer.
No single table layout fit everyone — reinforcing that a flexible, customizable table was a requirement, not a nice-to-have.
ETA changes → planning horizon changes → Last Free Date / D&D exposure can change → shipment priority changes. That made ETA, Last Free Date and D&D exposure a connected planning problem rather than separate data points.
The CSA needed answers, not another D&D report.
What is exposed?
Is D&D applicable, At Risk, Incurring or Incurred?
When does free time end?
What is the current Last Free Date?
What should I prioritize?
Which shipment needs attention before cost increases?
Why did it happen?
What Reason Code and Responsible Party explain the cost?
What should I do?
Can I move from exposure directly into planning?
What do I tell the customer?
Reason, number of days and applicable cost.
Move the decision, not just the data. D&D should appear where delivery priorities are being decided.
Move D&D from a back-office calculation to a planning signal.
The shift was not to expose more data. It was to make the D&D consequence visible at the moment the CSA decides what to plan first. ETA, Last Free Date, D&D exposure and priority needed to be understood as one planning decision rather than separate pieces of shipment information.
A planning view that surfaces the signals a CSA needs to act.
Last Free Date
Show the estimated or actual boundary for free time.
D&D status + cost
Make At Risk, Incurring and Incurred states visible with applicable cost.
Planning priority
Use D&D exposure to identify equipment that needs attention first.
Milestone + ETA
Keep the event and expected timing that shape the decision visible.
Reason + responsibility
Connect incurred cost to its operational cause and owner.
Alert → planning
Move from a D&D signal directly into the relevant planning action.
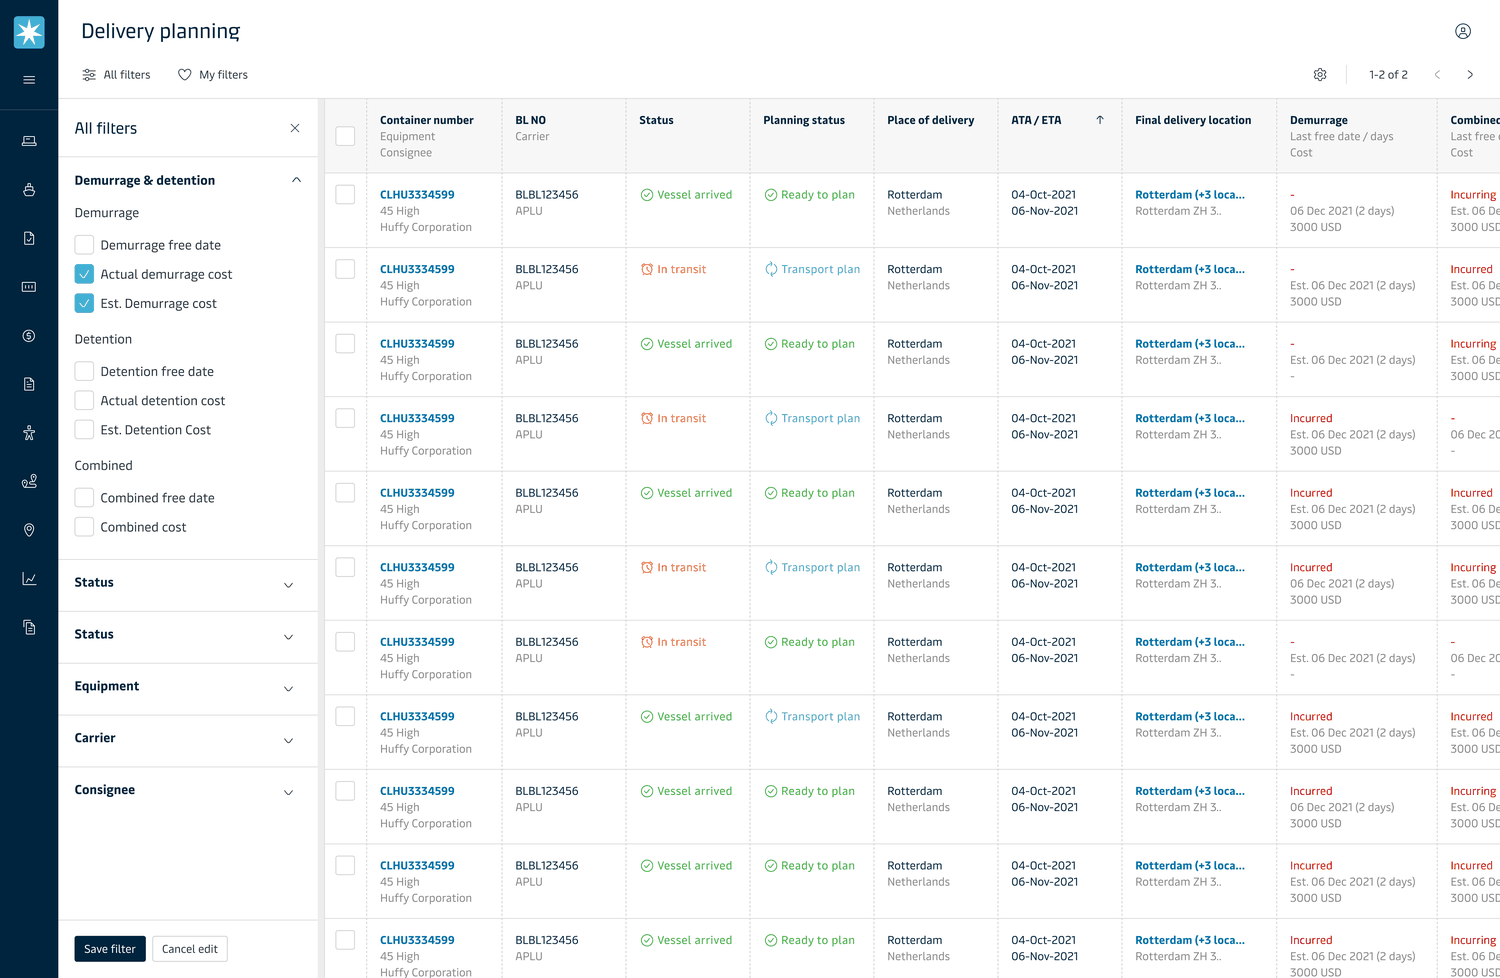
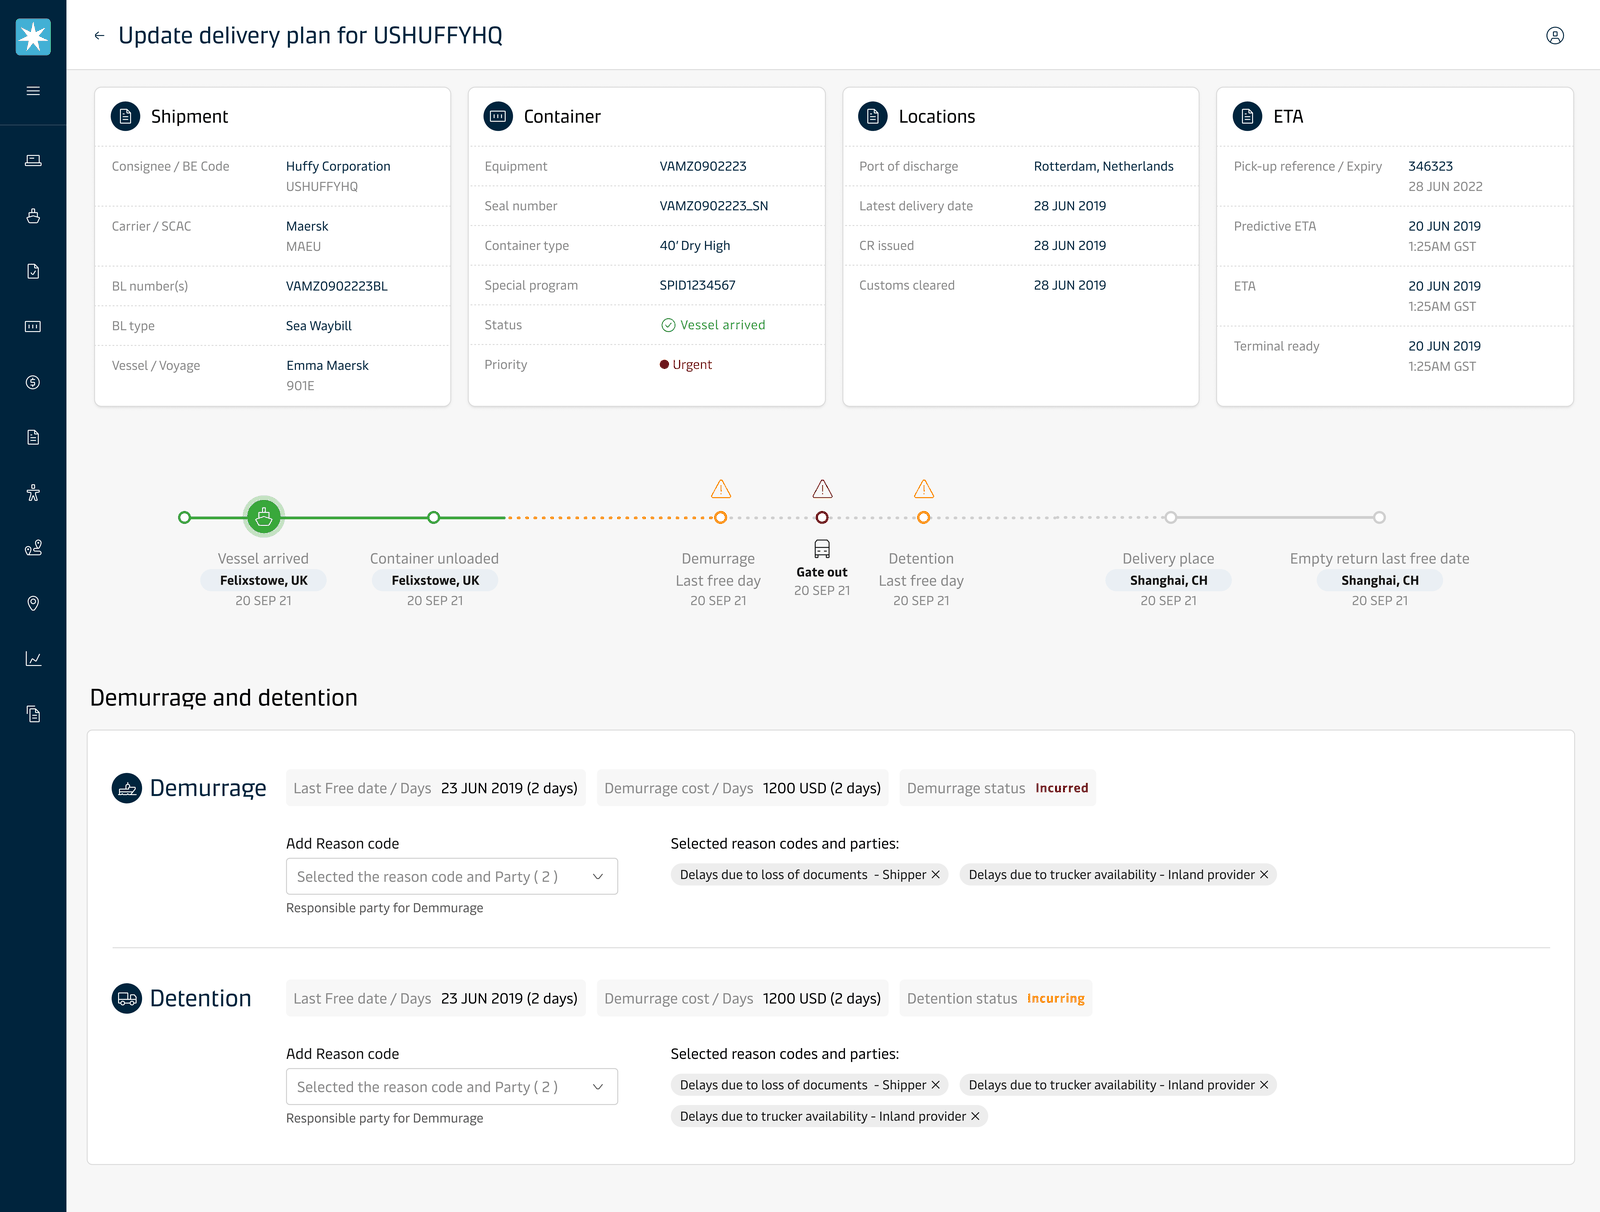
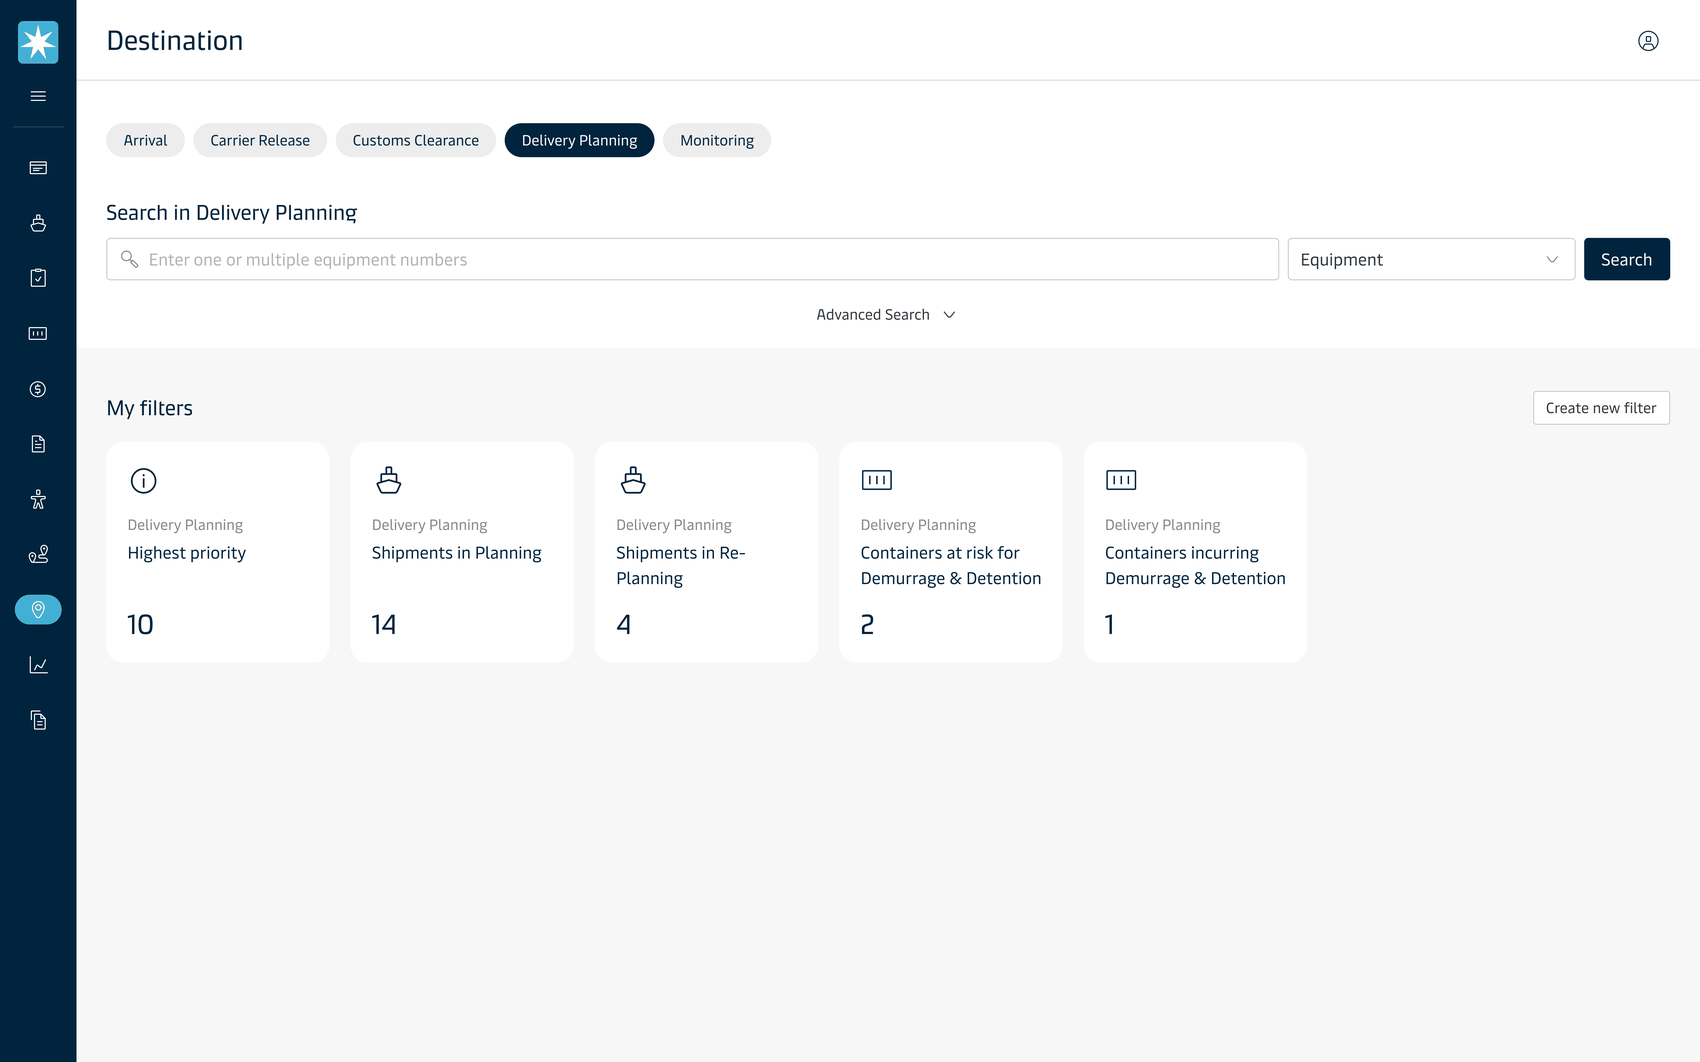
From information overload to focused action.
I tested whether CSAs could move from a dense operational view to a clear D&D decision.
Planning list
One operational view for equipment, BL, status, planning status, POD, ETA, ATA, final delivery, Last Free Date, priority and PO.
Priority configuration
Customer-specific rules shape what gets surfaced first rather than forcing one fixed prioritization model.
D&D intervention
At-risk and incurring states provide a reason to act, with direct navigation into root-cause analysis.
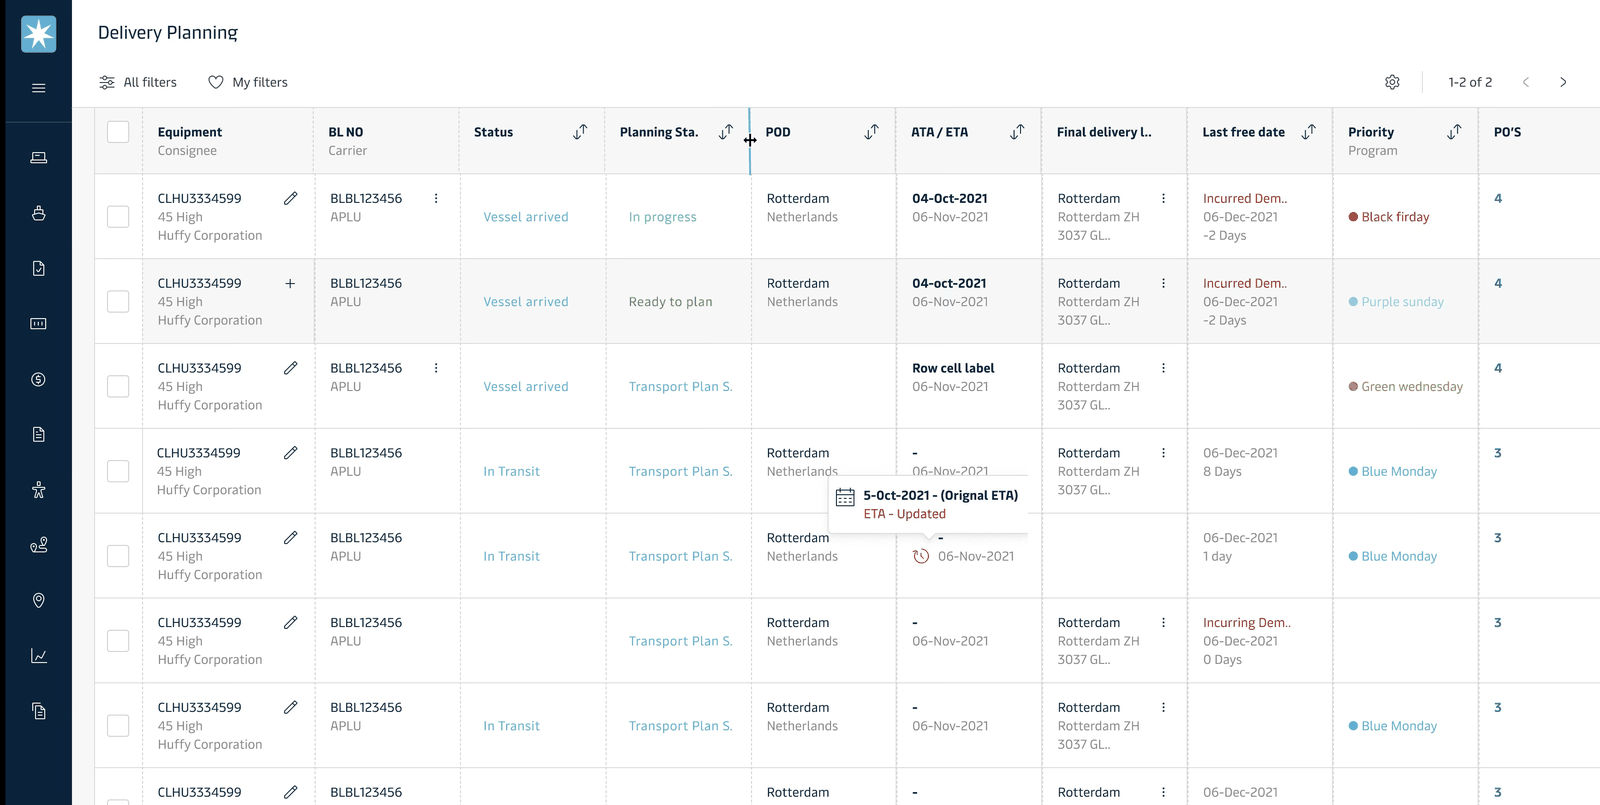
Validation focused on whether the D&D signals were clear enough to act on.
Too much competing for attention
D&D context was difficult to connect to the planning decision.
“What do I act on first?”
Users needed stronger hierarchy around deadline, exposure and priority.
Prioritized D&D signals
Strengthened hierarchy around Last Free Date, D&D status, cost and action.
Clearer path to action
Made D&D exposure easier to connect to delivery planning.
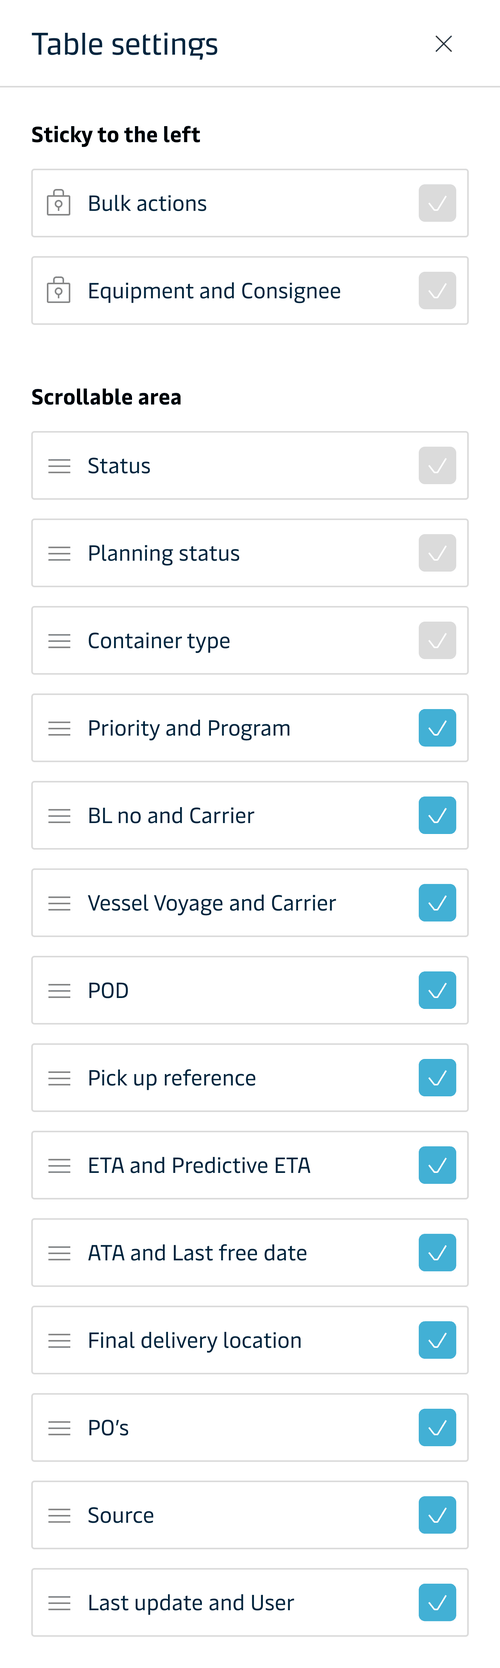
Validation changed the table, too.
Different customers and tasks required different views, so one fixed table could not fit every workflow.
Save your own layout
Choose visible columns, order and sort—and save the view for your workflow.
Sort & filter from the header
Move sorting and filtering into the column header for faster scanning.
Import & export
Keep Excel part of the workflow with native import and export.
Mimic Excel, on purpose
Use familiar Excel patterns—like freeze columns and sorting—to reduce the learning curve.
ETA and ATA were separated so each could be independently sorted and scanned.
From exception → intervention.
Cost becomes applicable → CSA is notified → shipment opens → D&D context is visible → equipment is prioritized → delivery plan is reviewed → reason / owner is captured → customer is informed.
Planning nudge
Notify the CSA when D&D cost becomes applicable or a container enters an Incurring state.
Next action
Take the user directly to the relevant shipment so they can review exposure and start or adjust planning.
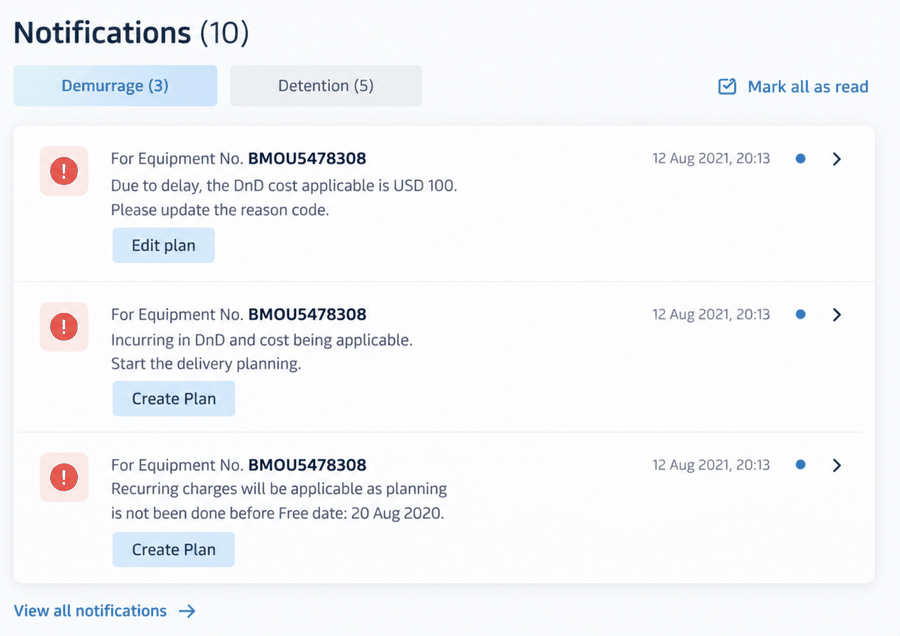
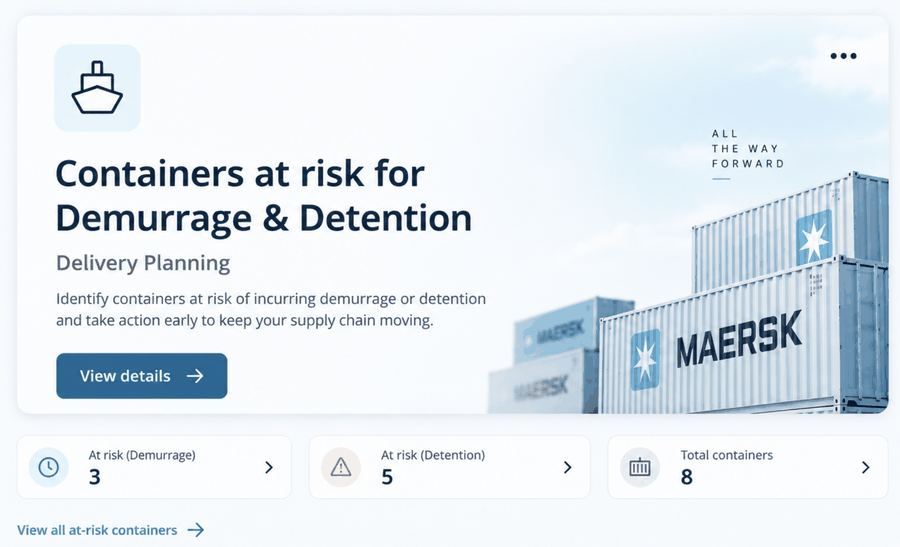
My focus was the D&D decision layer inside Delivery Planning.
I focused on making Last Free Date, D&D status, cost exposure, prioritization, alerts and root-cause context visible at the point of delivery planning.
Not yet achieved outcomes—targets for what comes next.
The interface became simpler once the D&D decision model became clearer.
Instead of requiring CSAs to reconstruct D&D exposure through separate calculations, the experience brings together ETA → Last Free Date → D&D exposure → Priority → Action at the moment the delivery plan is being made.
"The goal was not to hide the underlying rules. It was to structure them around the decisions a CSA actually needs to make."
Giving every building an identity — and every journey a clearer destination.
Bawsala turns complex addresses into a searchable identity for the exact entrance people need to reach.


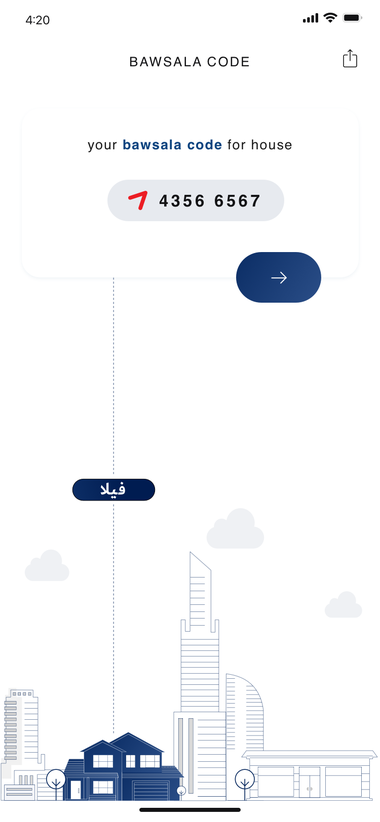
One address can contain many entrances. Bawsala gives each entrance a simple identity.
Find the right entrance
People need to find the right entrance, not just the right address. Bawsala creates a unique code for every entrance and makes it searchable and shareable.
A reliable shared reference
Drivers and businesses need a location they can reliably identify, communicate and navigate to without depending on long or ambiguous addresses.
JDMR 8767 · JD = city code · MR = area code · 8767 = entrance code
The product made one location identity useful across the journey.
Identify
Give each building entrance a simple, unique code that people can recognize and search.
Navigate
Carry the selected destination into maps and routing without losing location context.
Share
Give customers, drivers and businesses one location reference they can reuse and communicate.
Addresses were precise enough for databases, but not always precise enough for people or drivers.
Long, multi-line addresses
Harder to search, remember and communicate consistently.
One unique code
Every entrance gets a searchable identity.
Many entrances, one address
The destination was not always the exact entrance.
Exact destination
The code points people toward the intended entrance.
Different navigation tools
Finding and reaching a place could require multiple steps.
Navigation in context
Move from search to route without losing the location.
Location shared as an explanation
People needed a simple reference they could send to others.
Shareable location
A Bawsala code can be shared in seconds.
I owned the interaction model across location identity, search, navigation, and reuse.
Address → location identity
Turned the address problem into a location-identity problem, focused on the entrance people actually needed to find.
Connect identity to discovery
Shaped search, advanced filtering and the transition from code to place.
Connect discovery to navigation
Carried the location context into map and routing experiences for customers and drivers.
Make the code useful beyond search
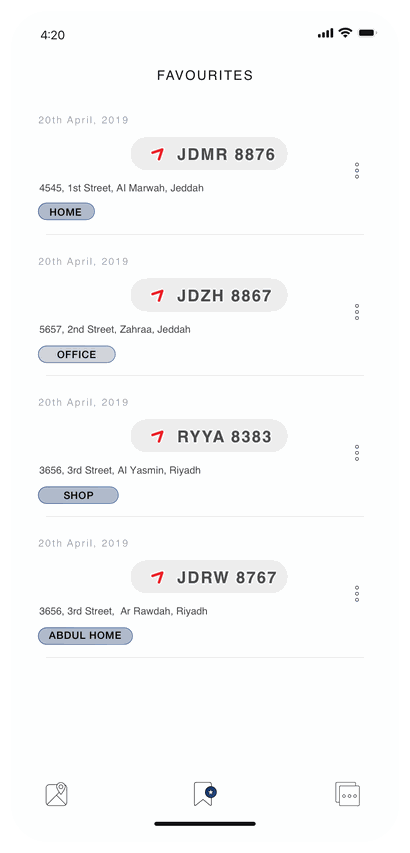
Extended the identity into sharing and saved/favourite locations.
Started as the sole designer → team grew to 5–6. I joined as the first and only designer, owning the experience independently for the first two months as the team was forming. Leadership visited India quarterly, enabling direct discussions on product and business requirements. As the team expanded, I continued close collaboration with product and technology on the evolving product and backend address-marking workflows.
The address wasn't the destination. The entrance was.
Address ≠ entrance
A single address can lead to multiple entrances, so the destination needs more precision.
A code needs to be findable
The identity becomes useful when people can search for it quickly.
Identity should persist
The same location reference should carry into navigation and sharing.
Identify → Search → Confirm → Navigate → Reuse. These findings shaped the interaction model end to end.
The code had to work beyond search.
I treated the code as a persistent location identity — not just a search key — so it could carry through confirmation, navigation, sharing and reuse.
Entrance as destination
Make the entrance, not just the address, the destination.
Find by code
Let people find the destination by its unique code.
Context before navigation
Show the selected place in context before navigation.
Continue into routing
Continue into routing without losing the destination.
Share and save
Make the same code useful for sharing and saved places.
Find the right entrance in a few deliberate steps.
Search by code
Use the unique Bawsala code to locate the intended entrance.
Use structured search
City, area and entrance-code filters make discovery easier to narrow.
See the destination in context
Make the selected place understandable before moving into navigation.
Share or save the location
Reuse the same code with other people or from a favourites list.
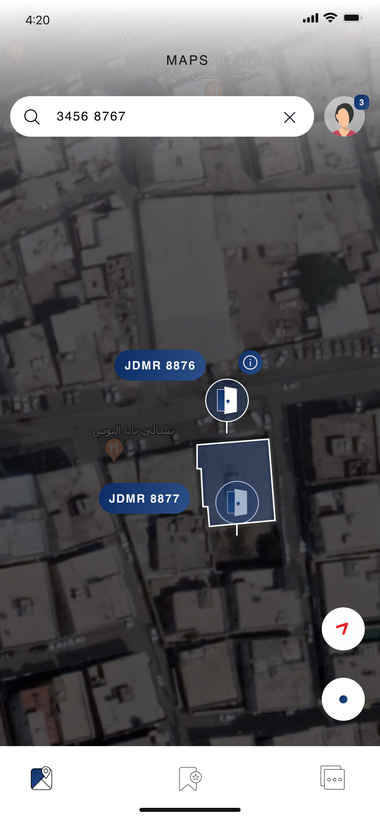
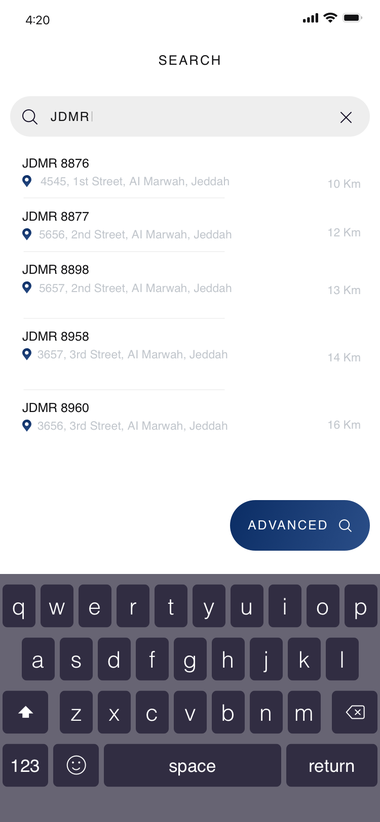
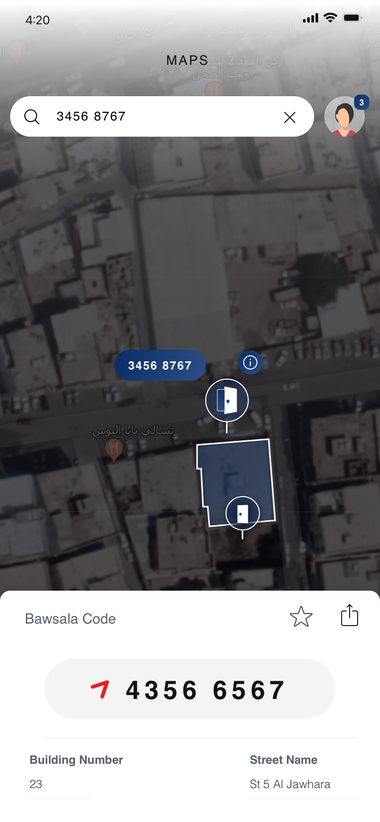
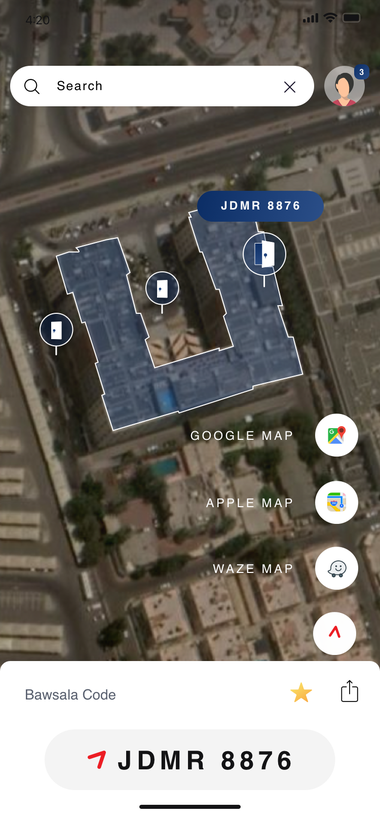
The same identity reduces ambiguity after the address is shared.
Arrive at the intended destination
Carry the shared location into tracking and routing so the destination stays clear during the journey.
Use one consistent location reference
Give customers and delivery operations the same location identity to communicate.
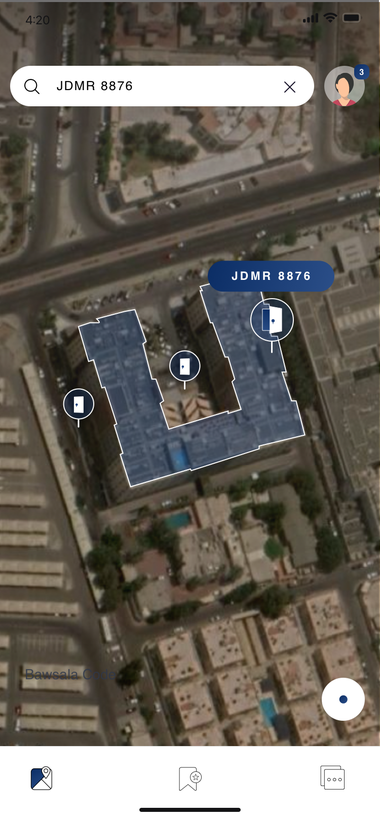
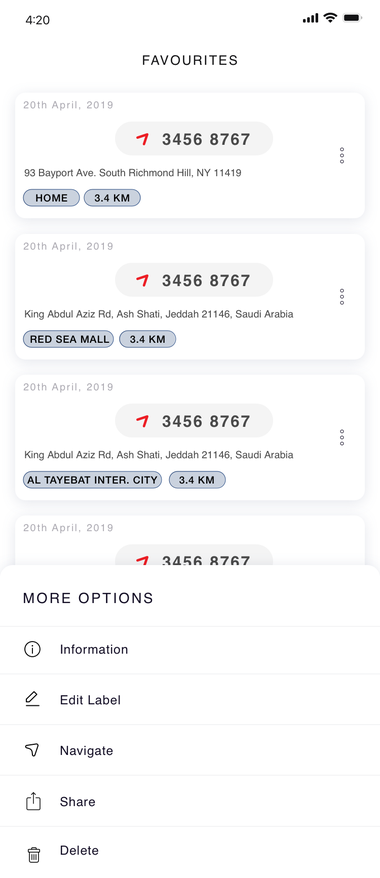
From location code to arrival.
Search code → confirm entrance → view destination → choose navigation → arrive → share or reuse. The key interaction decision was to keep the location identity consistent as users moved between discovery, navigation and communication.
The concept expanded from a code into a reusable location identity.
Unique entrance code
Make each entrance identifiable.
Searchable destination
Make the code useful for finding a place.
Navigation + sharing
Carry the same identity through arrival and communication.
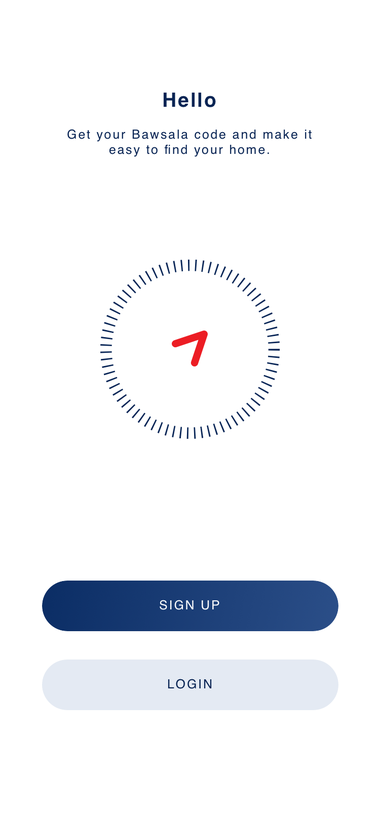
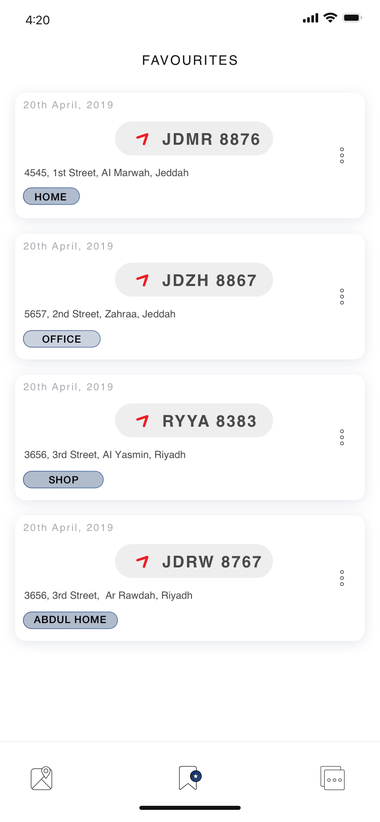
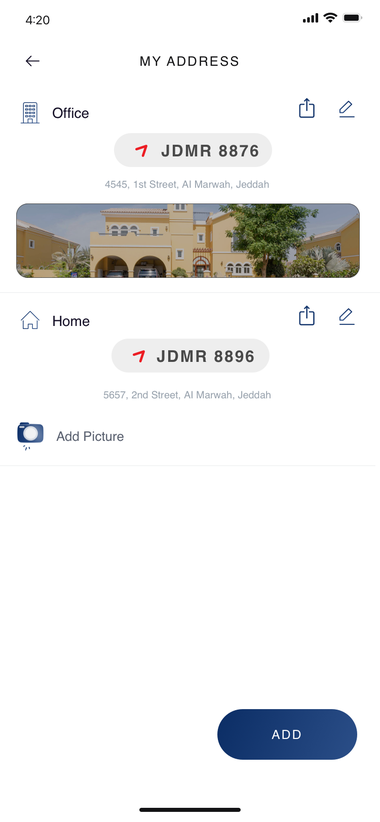
The experience became simpler once the address was treated as a destination identity.
The product addressed a real problem, but the market increasingly standardized the underlying solution.
A simpler digital address experience
Bawsala turned a long address into a simple code that could identify an entrance, support search, navigation and sharing.
The ecosystem moved toward a national standard
Saudi Arabia established its National Address in 2013, before Bawsala launched in 2018. Saudi Post | SPL also provides a Short Address using 4 letters and 4 numbers. In August 2025, the Council of Ministers adopted the National Address as the sole source for addressing in the Kingdom.
Bawsala's proposition increasingly overlapped with an addressing capability embedded in the national ecosystem. Public evidence supports that market overlap and later standardization; it does not establish that this was the only reason for Bawsala's adoption outcome.
"The UX solved a real address problem. The market increasingly standardized the underlying solution. The lesson: solving a user problem does not always create lasting product differentiation."
Making working capital easier for small businesses to access and use.
Designed the digital credit and Buy Now, Pay Later experience for buyers and sellers on Solv's B2B marketplace — bringing short-term revolving credit, invoice financing and repayment into a clearer working-capital journey.
Solv brought Buy Now, Pay Later into the B2B buying moment.
Quick access to working capital
Small businesses could be short on cash while still needing to finance inventory and day-to-day operations. BNPL created more time to pay without relying on traditional credit journeys.
Credit connected to real transactions
Buyers received short-term credit against invoices, sellers could be paid upfront, and lending partners financed the underlying business transaction.
Make the financing choice, credit state and repayment journey understandable at the moments an MSME needed to act.
This case study is protected under NDA.
The full screens, design process, and product rationale are available to approved reviewers. Enter your password below, or request access for the complete walkthrough.
Designing around three moments in the small-business credit journey.
Know what is available
Make available credit and remaining capacity easy to interpret.
Choose financing in context
Bring Pay Later and invoice finance into the payment decision.
Understand what happens next
Connect verification, repayment, statements and account state.
Pay Later sat at the centre; invoice finance and credit management supported the journey.
Short-term revolving credit
Use credit across multiple invoices and repay on a flexible schedule.
Finance the underlying order
Connect payment to the invoice rather than treating credit as a separate activity.
Manage the broader credit relationship
Extend the experience into card controls, credit utilisation and account management.
Access to credit was valuable only if the interface made the money, state and next action clear.
Credit numbers compete
Approved, available and used limits are easy to confuse.
One credit picture
Make available and used credit understandable together.
Financing is separated from payment
The Pay Later choice needs to appear when the business is deciding how to pay.
Pay Later at the point of choice
Present financing alongside payment options.
Account states create uncertainty
KYC, activation and pending conditions need explicit feedback.
Clear state → next action
Explain verification, activation and exceptions.
Repayment spans multiple views
Invoices, transactions and statements need to connect.
Connected repayment context
Return payment outcomes to the credit account.
I translated lending requirements into prototypes and mobile product experiences.
Understand product and business requirements
Worked with product, business stakeholders and leadership to understand the financing model, user states and operational constraints.
Turn financial logic into usable flows
Mapped Pay Later, invoice finance, onboarding, verification, repayment and card-management states.
Make concepts tangible early
Designed and iterated prototypes to communicate concepts, explore alternatives and support stakeholder decisions.
Work closely across functions
Collaborated with product, business, technology and stakeholders as backend conditions and requirements evolved.
Solv used technology and lending partners to extend financing into the B2B marketplace.
Solv positioned itself as a B2B e-commerce platform and financial-services marketplace for MSMEs, working with banks, NBFCs and fintech partners. Its January 2021 announcement described BNPL as invoice financing for buyers and sellers, designed to support immediate business needs with more flexibility.
In lending, clarity is part of trust.
Show the number a user can act on
Available, utilised and approved limits must be distinguishable.
Explain what happens next
Pending, verified, activated and overdue states need explicit feedback.
Put financing in context
Pay Later is most useful when it is visible at the payment decision.
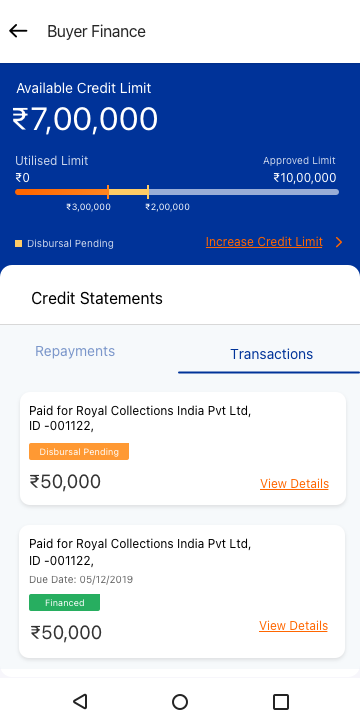
Make the credit line understandable before the business decides how to use it.
Available credit
Show approved, utilised and available amounts with a clear remaining balance.
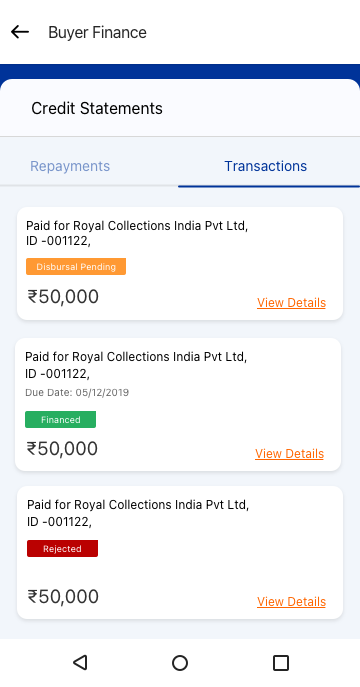
Statements & transactions
Make repayment and transaction history explainable.
Use or request more
Keep the next credit action visible when the business needs it.
Bring financing into the payment decision without adding cognitive load.
Payment option
Pay Now, Cash on Delivery or Pay with Invoice Finance.
Invoice & drawdown
Show invoice and drawdown details before confirmation.
Verification
Complete OTP / required verification where applicable.
Success & remaining credit
Explain successful request, amount and remaining credit.
Account & statements
Return users to the Pay Later account and statements.
Every step should answer three questions — what am I using, what will I owe, and what happens next?
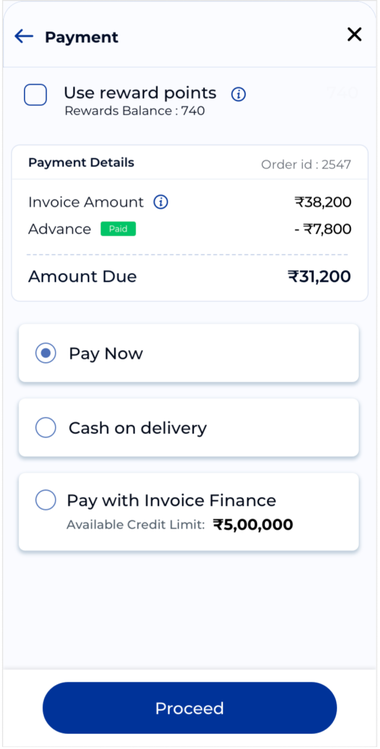
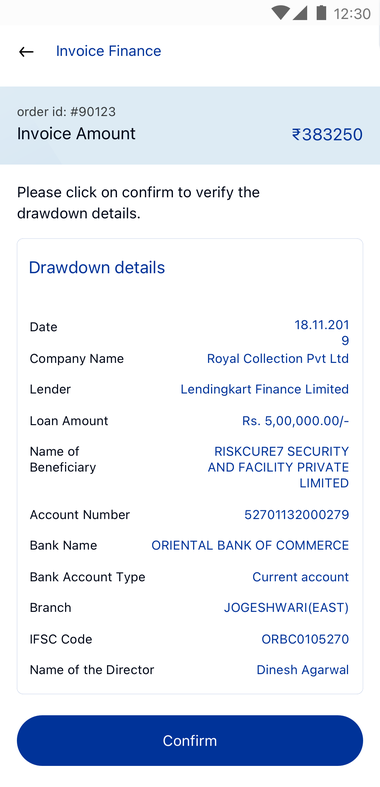
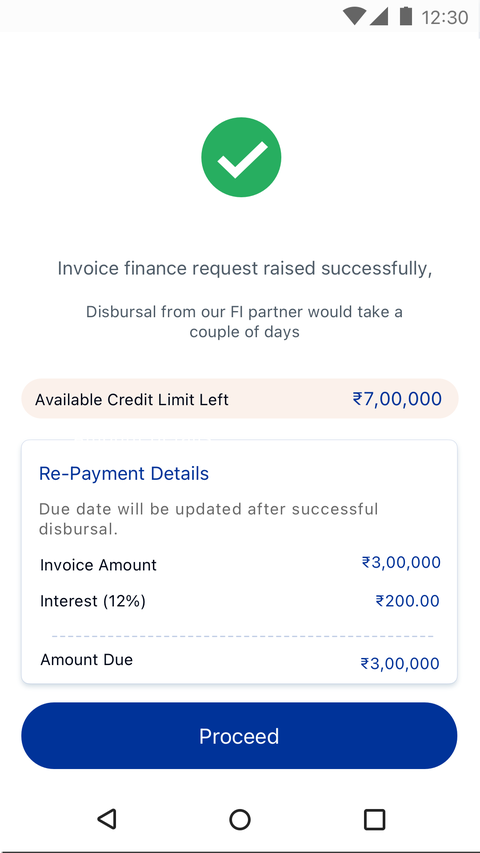
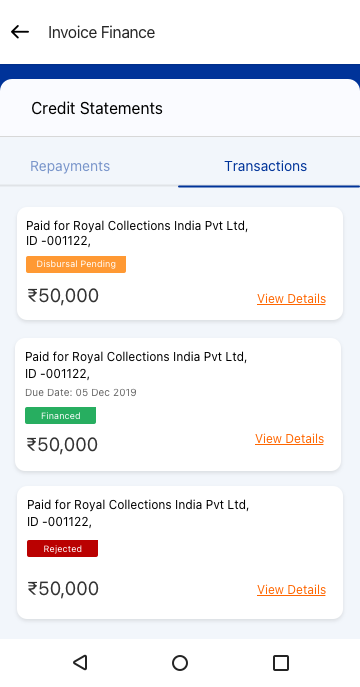
Payment choice → invoice detail → verification → successful drawdown → updated credit view. The flow was designed so the user always understands the financing choice, the amount being used and the state of the transaction.
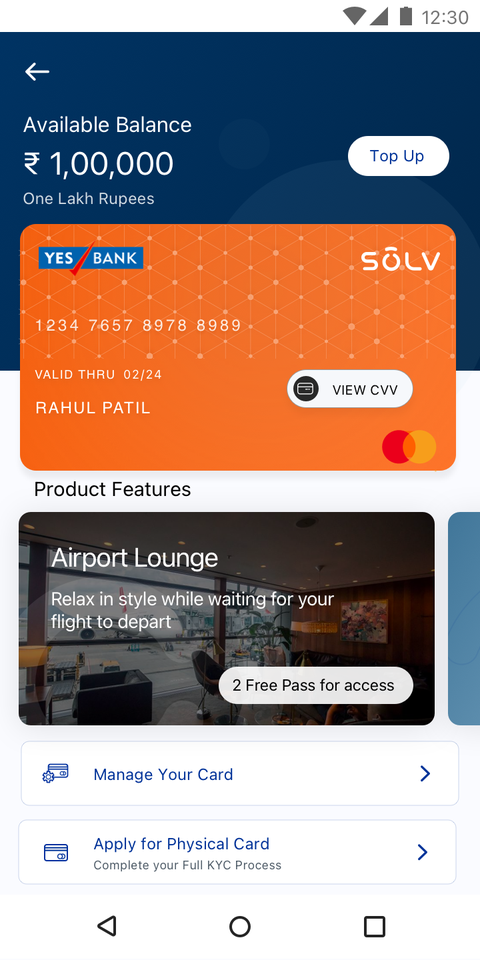
Extend the same clarity principles into card and account management.
KYC & activation
Guide users through registration, verification and activation states.
Manage the card
Support PIN, blocking, limits and international-usage decisions.
Understand utilisation
Connect card activity back to credit, transactions and repayment context.
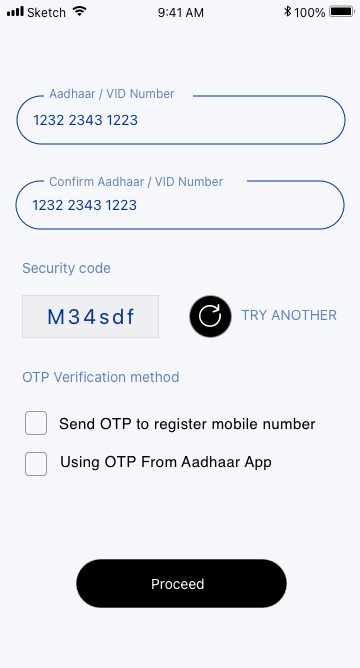
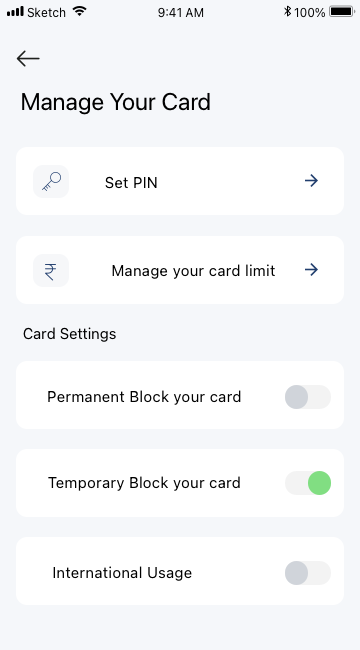
The work connected separate financial capabilities into one credit relationship.
Digital credit
Establish credit, KYC and activation.
Pay Later + invoice finance
Use financing directly within the B2B transaction.
Card + repayment
Track utilisation, statements, payment and controls.
The experience became clearer when money, state and action were designed as one system.
The work brought Pay Later, invoice finance, credit visibility, verification, card management and repayment into a more coherent product journey — a connected MSME credit experience rather than separate financial capabilities.
"In financial products, clarity is part of trust: users need to know what they can use, what they owe and what happens next."
Every handoff was a black box. Now it's one trackable journey.
Real-time shipment visibility across fulfillment, distribution and last-mile operations — because teams lost visibility across every handoff.
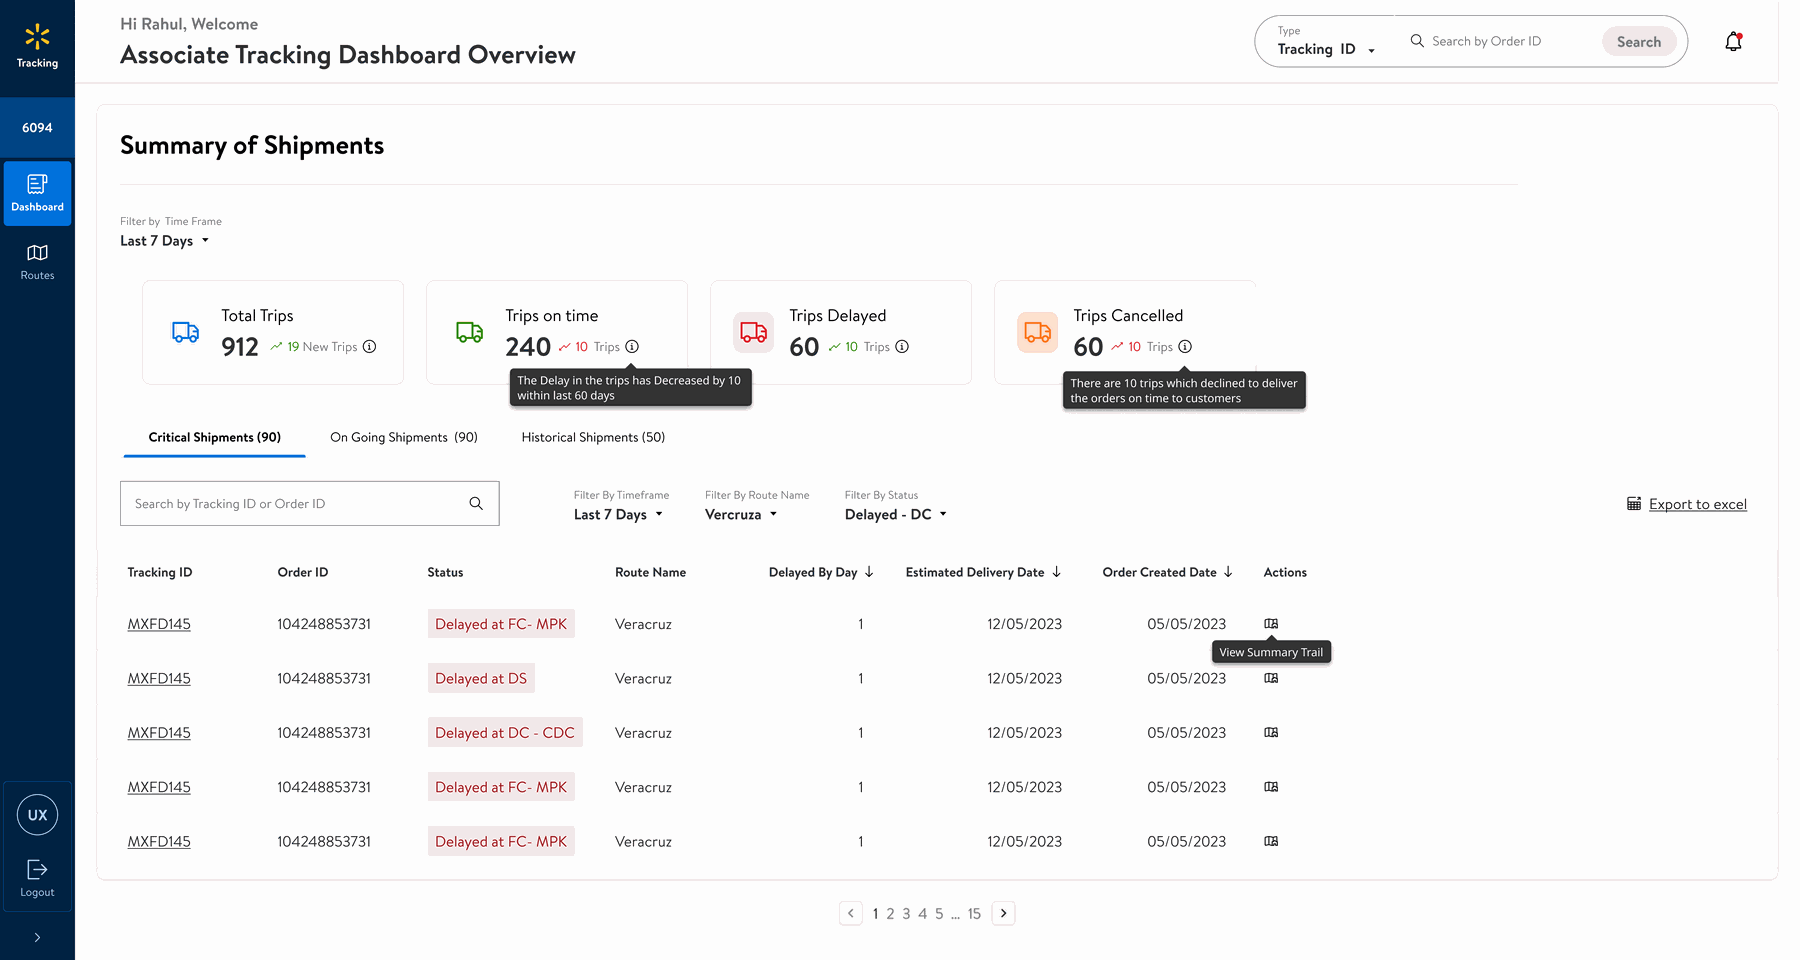
A shipment visibility and route-optimization experience for omni-channel operations across Mexico.
The initiative focused on a simple operational gap: once an order moved through the network, teams could no longer reliably see what was happening at each handoff. The opportunity was to connect fulfillment, distribution, stores, delivery stations and customer care around one trackable shipment journey.
The problem was not simply "no tracking." It was a fragmented operating model where shipment state disappeared between handoffs.
Visibility disappeared after handoffs
After the truck leaves the FC, teams lose order visibility en-route, with no system to record receipt.
One tracking view
A single view carries the shipment across the journey.
Teams reconstruct status manually
Order details are shared through manifest files, Excel, calls and WhatsApp.
Route + status context
Status, route and delay context sit together in one place.
Operational uncertainty reaches customers
Without capacity or event data, teams struggle to protect on-time delivery.
Critical shipments surfaced
At-risk shipments are visible before customers are affected.
Fragmented coordination touchpoints
Manifest files, calls, messages and WhatsApp became de facto coordination tools.
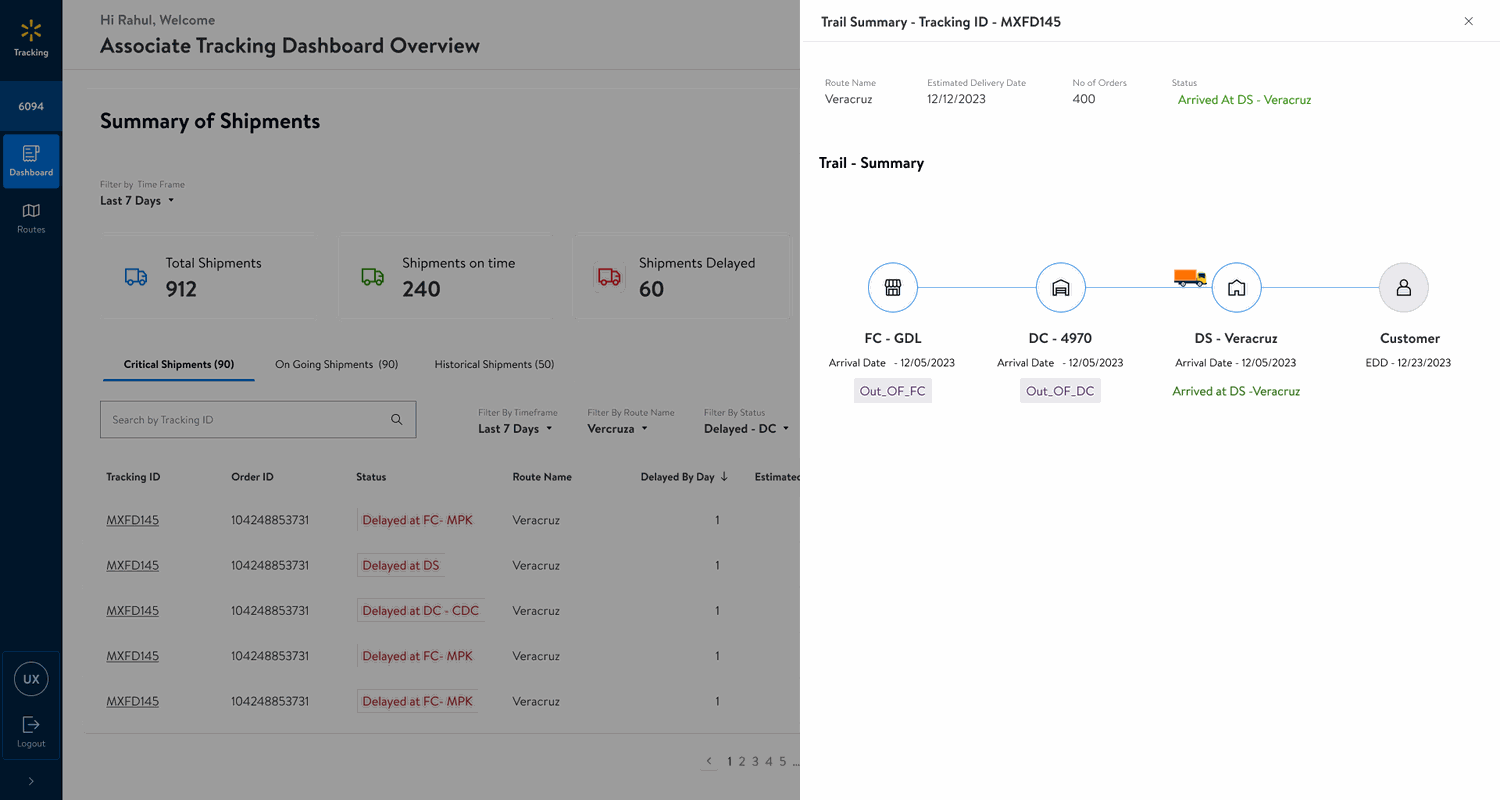
Summary trail for investigation
One trail supports proactive intervention instead of reactive searching.
Too many handoffs. Too little shared shipment state.
Three core user groups sit across the operational and customer-facing sides of the journey.
Transportation Operations Team
Tracks shipments in omni-channel routes, protects the SLA, and intervenes when shipments are delayed.
Operations Teams — E-Com & Bricks
Coordinates the physical network across fulfillment, distribution, stores and the Brick fleet.
Customer Care Team
Needs shipment status to update customers and escalate orders requiring transportation attention.
Track shipments in omni-channel routes.
Ensure orders reach customers within SLA, without loss of shipments.
Receive notification when shipments are getting delayed.
Track shipments so customers can be updated on status.
Escalate orders that need transportation attention.
Notify customers proactively if a shipment is delayed.
The evidence points to five recurring breakdowns.
Order visibility
No order visibility after the truck leaves the FC.
Manual effort
Significant manual effort to coordinate between FC / DC / Stores / DS.
DC visibility
Loss of visibility of orders within the DC.
On-time delivery
DC does not ship orders in the expected / promised time, creating an OTD risk.
Capacity
No capacity information at DC / trucks during promise calculation and route assignment.
The current journey is a chain of handoffs, but the customer experiences one shipment.
The design opportunity was to make those two realities match.
Fulfillment Center
No capacity feedback at promise calculation / optimized route assignment.
Distribution Center
Orders shared by manifest / Excel; shipment events not consistently recorded.
Store handoff
Need visibility when orders are received by the store.
Delivery Station / Last Mile
Once transport leaves the DC, downstream teams can be in the blind.
Customer
Needs shipment status and proactive delay notification.
Turn a fragmented network of handoffs into one visible shipment journey.
Make the shipment journey legible as a system, not a collection of handoffs.
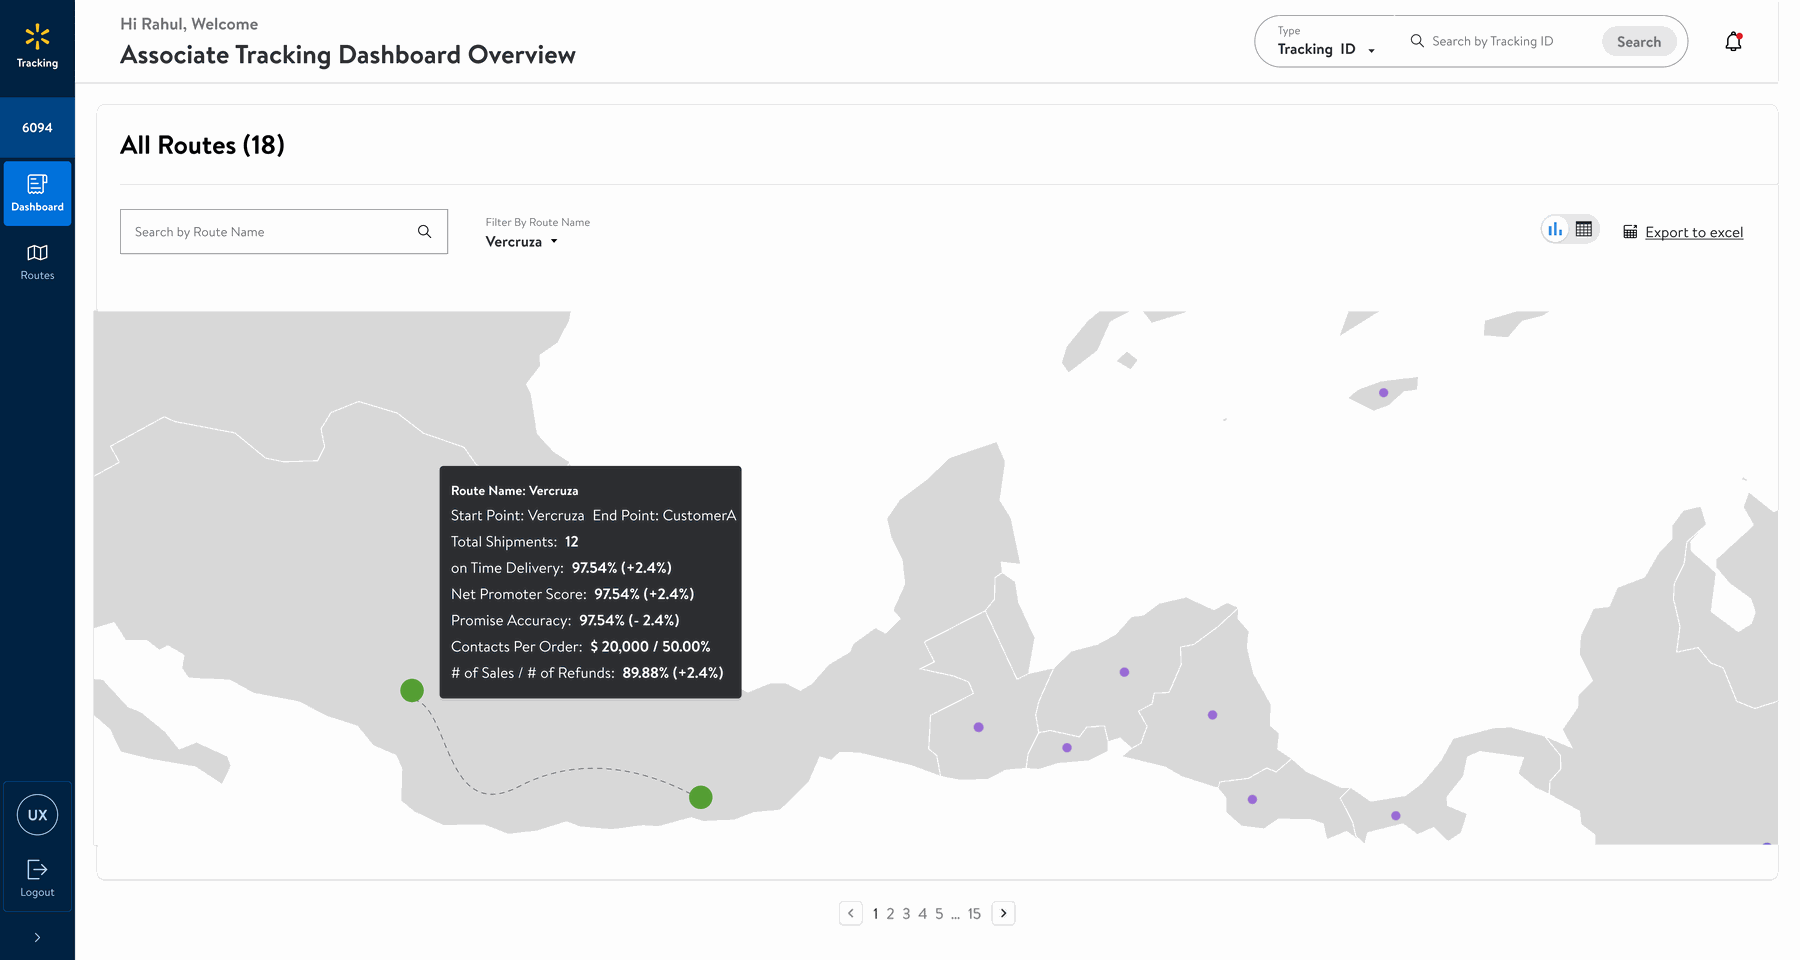
How might we help the Transportation Operation and Customer Operation teams get the tracking and visibility of shipment orders they need? Instead of asking teams to reconstruct status from files, calls and messages, the experience surfaces the shipment, its route, its current state and the action required.
Make state visible
Surface shipment state across the route.
Enable intervention
Surface delayed and critical shipments so teams can intervene.
Equip customer teams
Give customer-facing teams reliable status they can communicate.
Find → Prioritize → Understand → Act.
The dashboard turns a tracking problem into a decision-making workflow.
Search
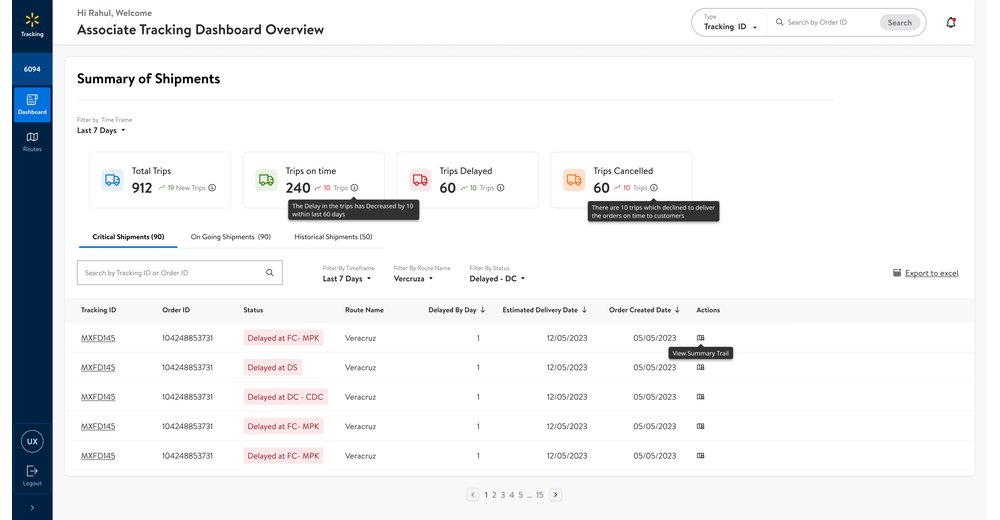
Search by Tracking ID or Order ID and filter the operational queue.
Focus
Use Critical, Ongoing and Historical shipment views to focus attention.
Context
See status, route, delay and estimated delivery context.
Intervene
Open the summary trail, coordinate intervention and communicate status.
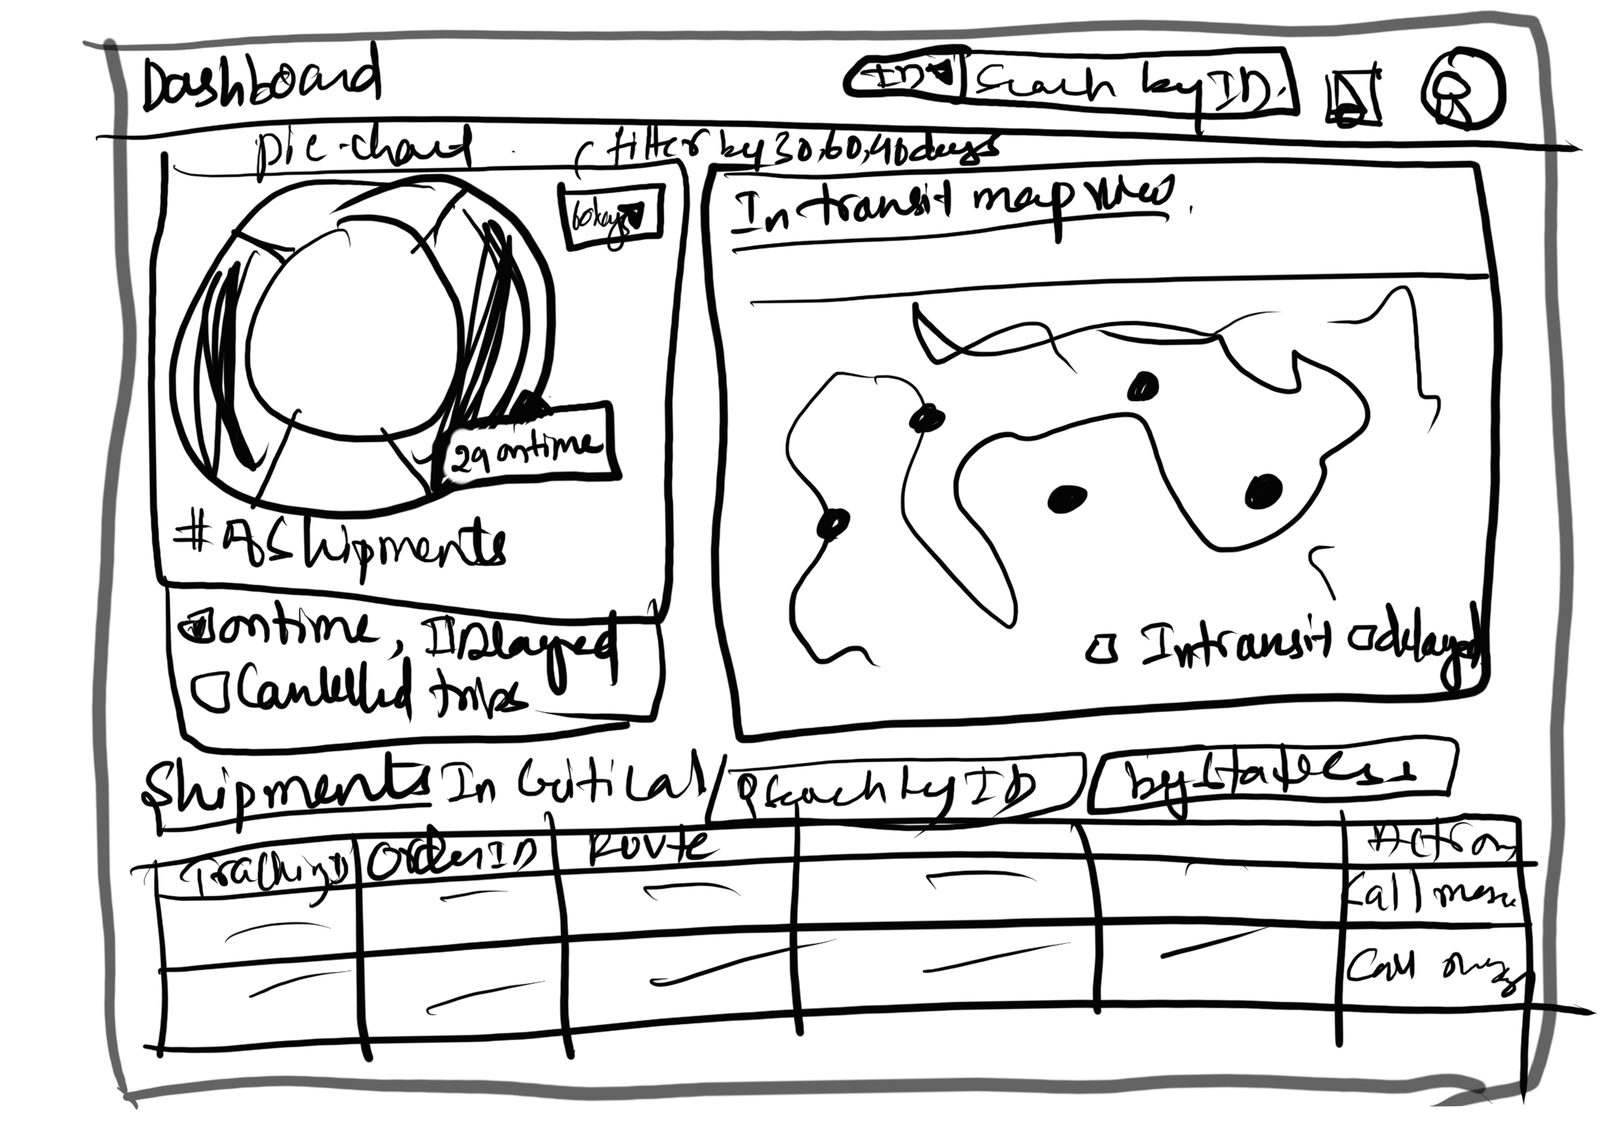
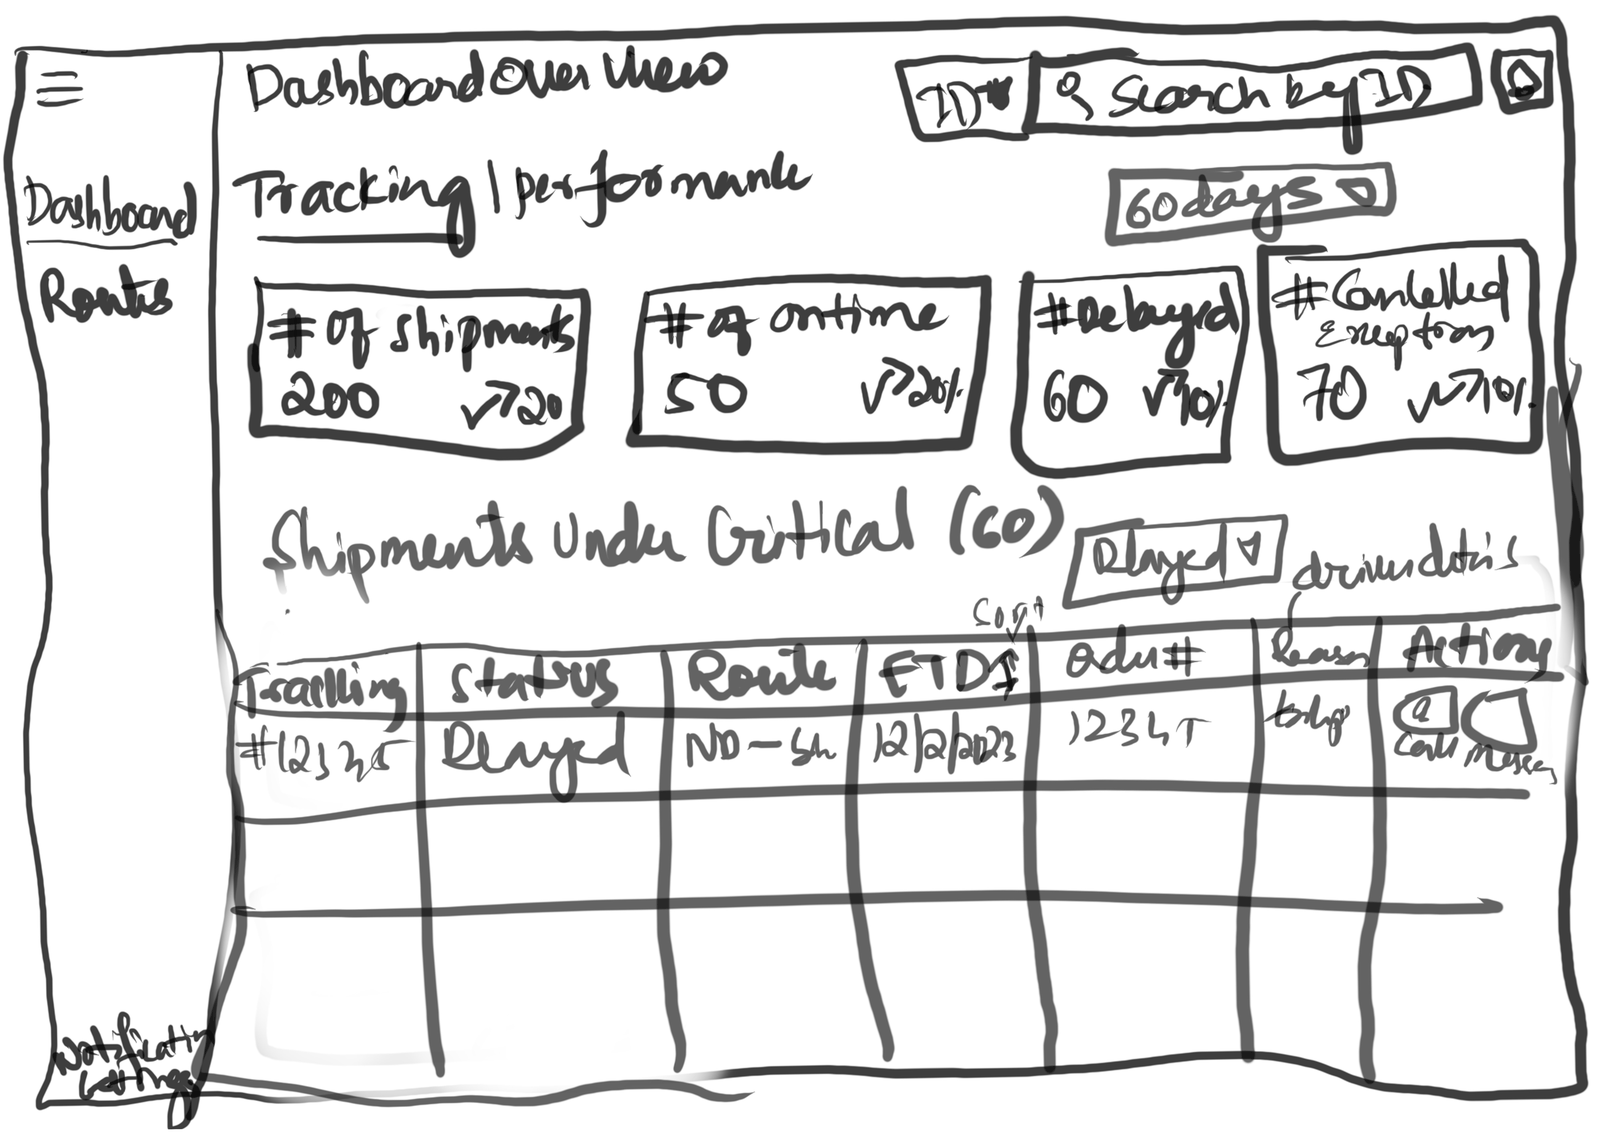
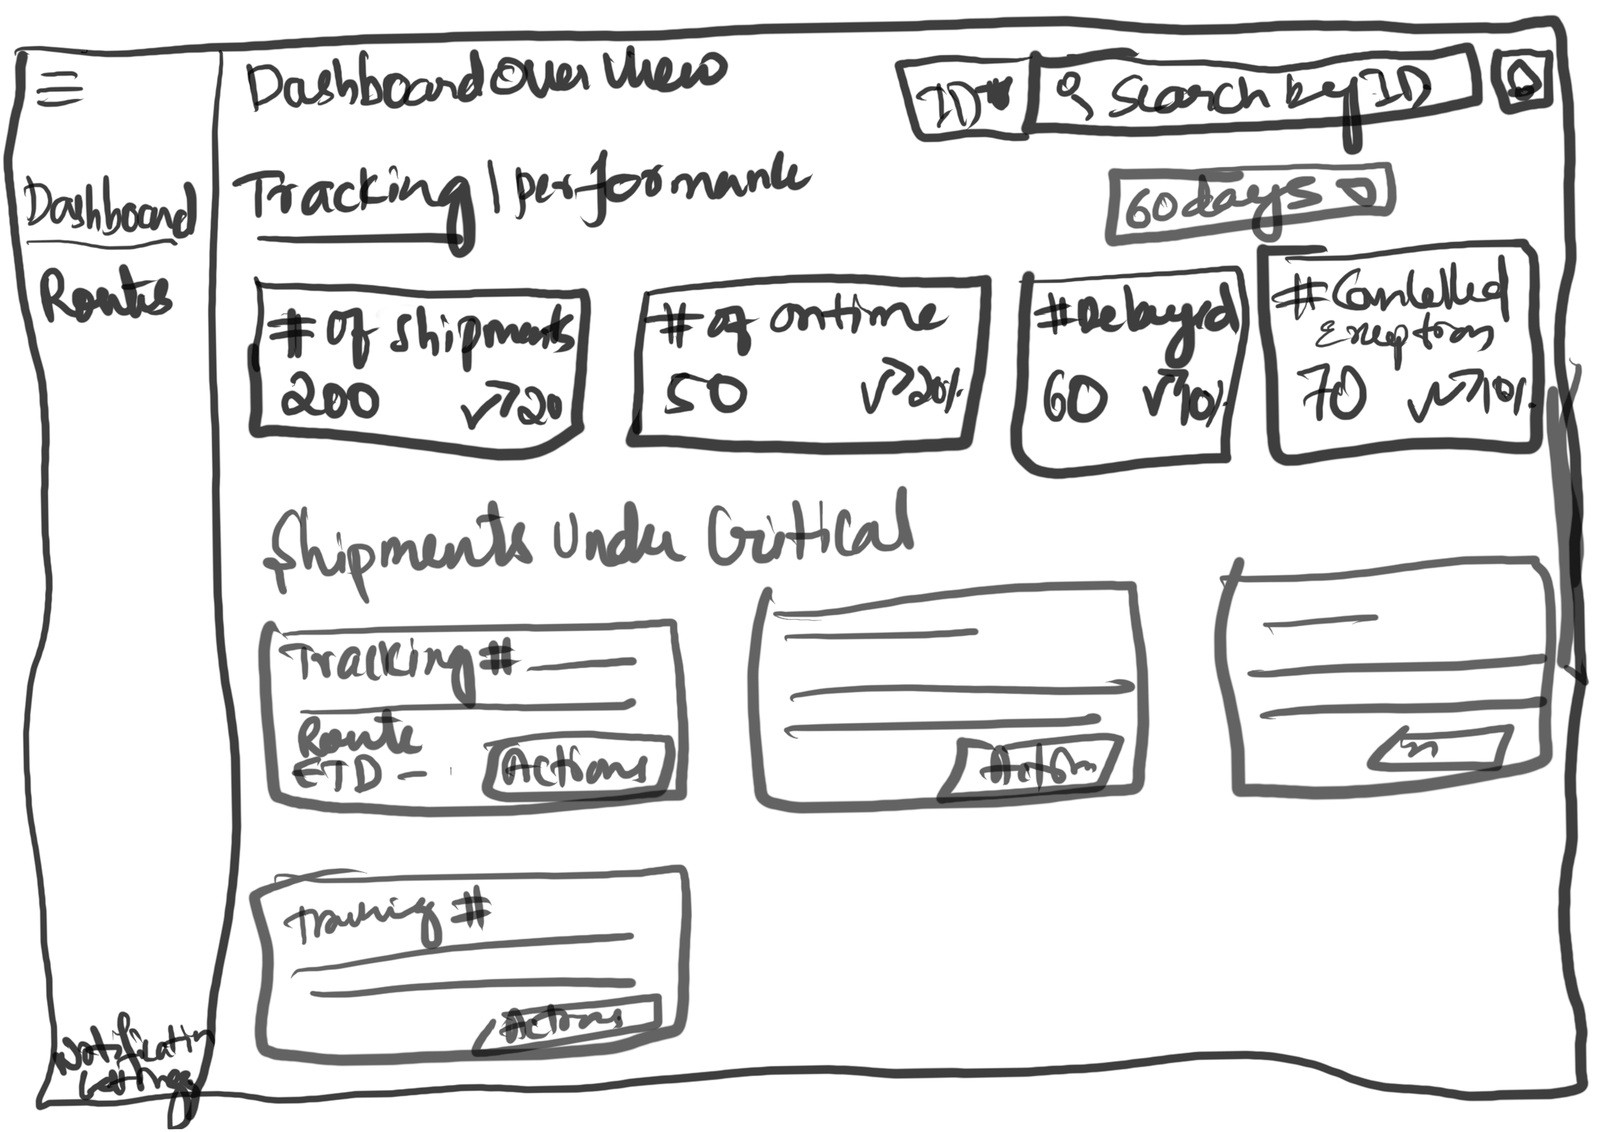
Early exploration
Low-fidelity passes worked out where KPIs, the map and the shipments table should sit before any visual design began.
Information architecture
Dashboard → Routes → Trips → Order detail, mapped across four levels before any screen was built.
- Global searchSearch by trip or by order.
- NotificationsDelayed trips and status changes surfaced proactively.
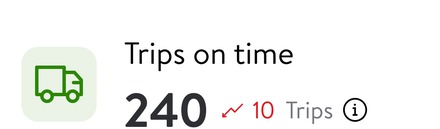
- Summary of all routesTotal, on-time, delayed and cancelled trips — filterable by date range.
- Critical tripsDelayed shipments that need Associate attention.
- All routesTable and map view, KPIs per route.
- Route summaryFC → DC → DS → Customer flow, total trips, orders per node.
- Performance KPIsOn-time delivery, promise accuracy, NPS, CPO.
- Ongoing tripsTrip ID, status, driver details, expected end time.
- Historical tripsCompleted trips — actual vs. expected end time.
- Trip summaryTrip ID, driver name, contact, status.
- Trip timelineFC → DC → DS → Customer tracking.
- Order listOrder ID, destination, status and estimated delivery.
- ActionsCall driver on delayed, exception or failed-delivery orders.
- Order tracking detailsOrder ID, load number, MPL number, facility, timestamp and carrier — for FC, DC and DS.
Filtered by All, Orders or Trips — surfaced from the dashboard's global search.
Same delayed-trip and status alerts, opened from the bell icon.
The shipped experience
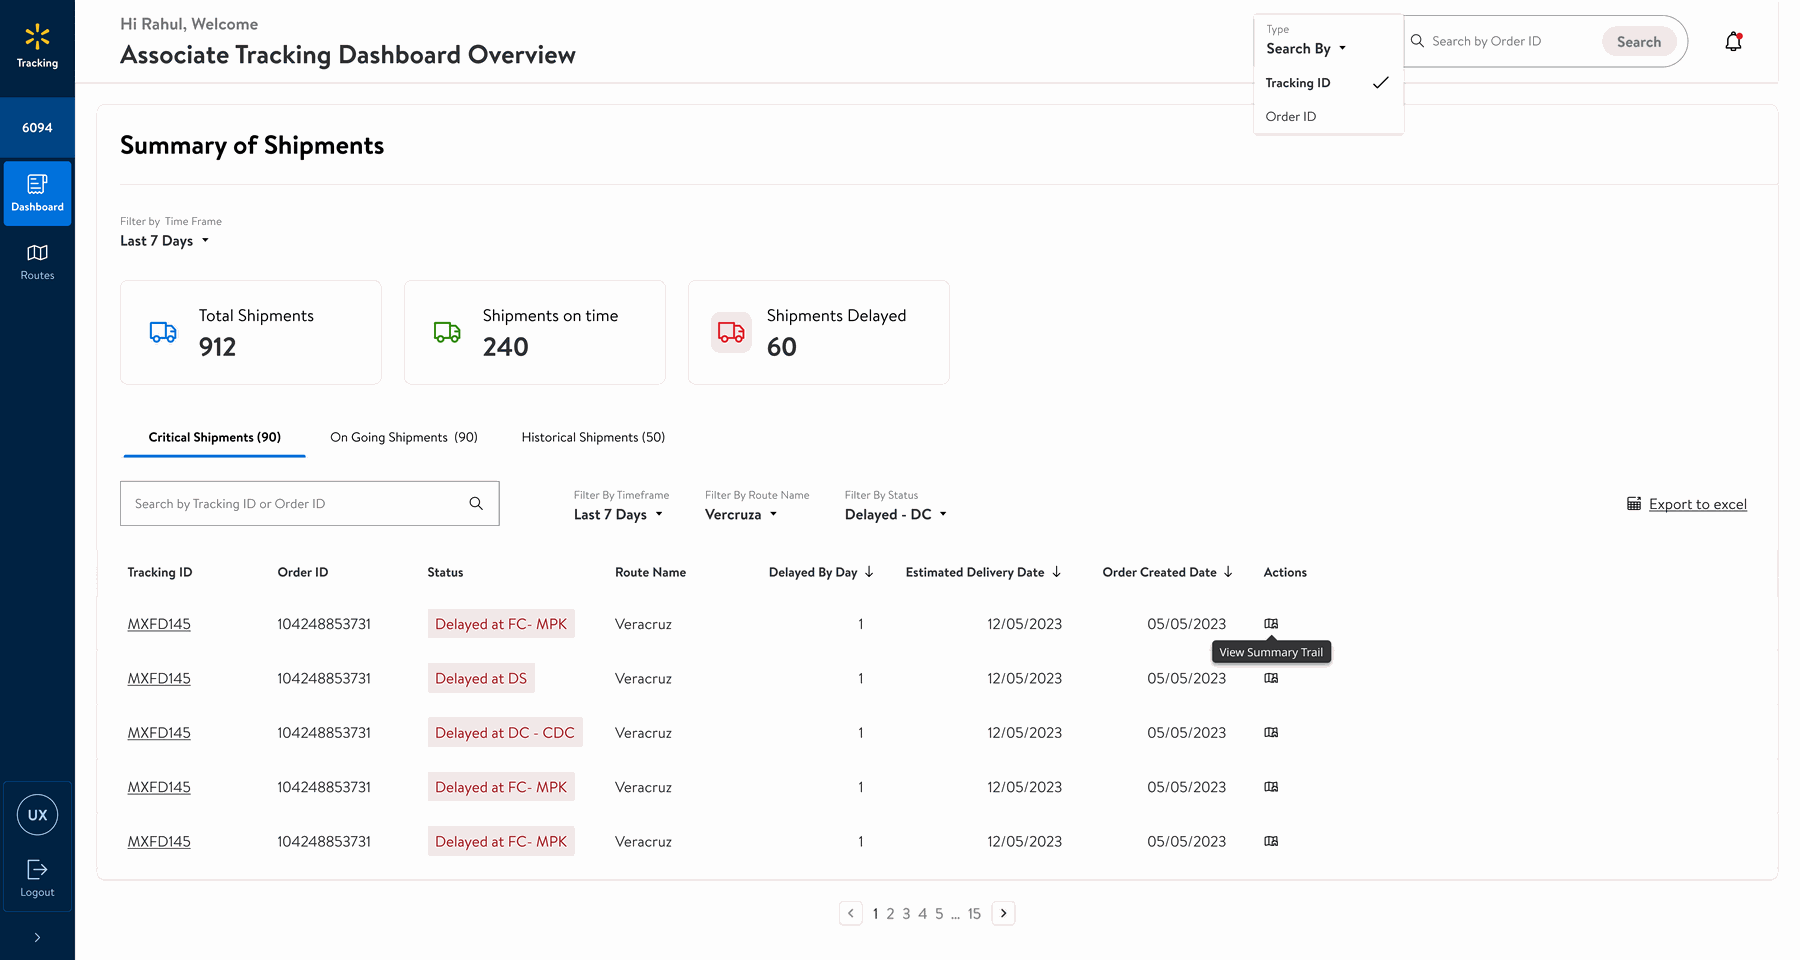
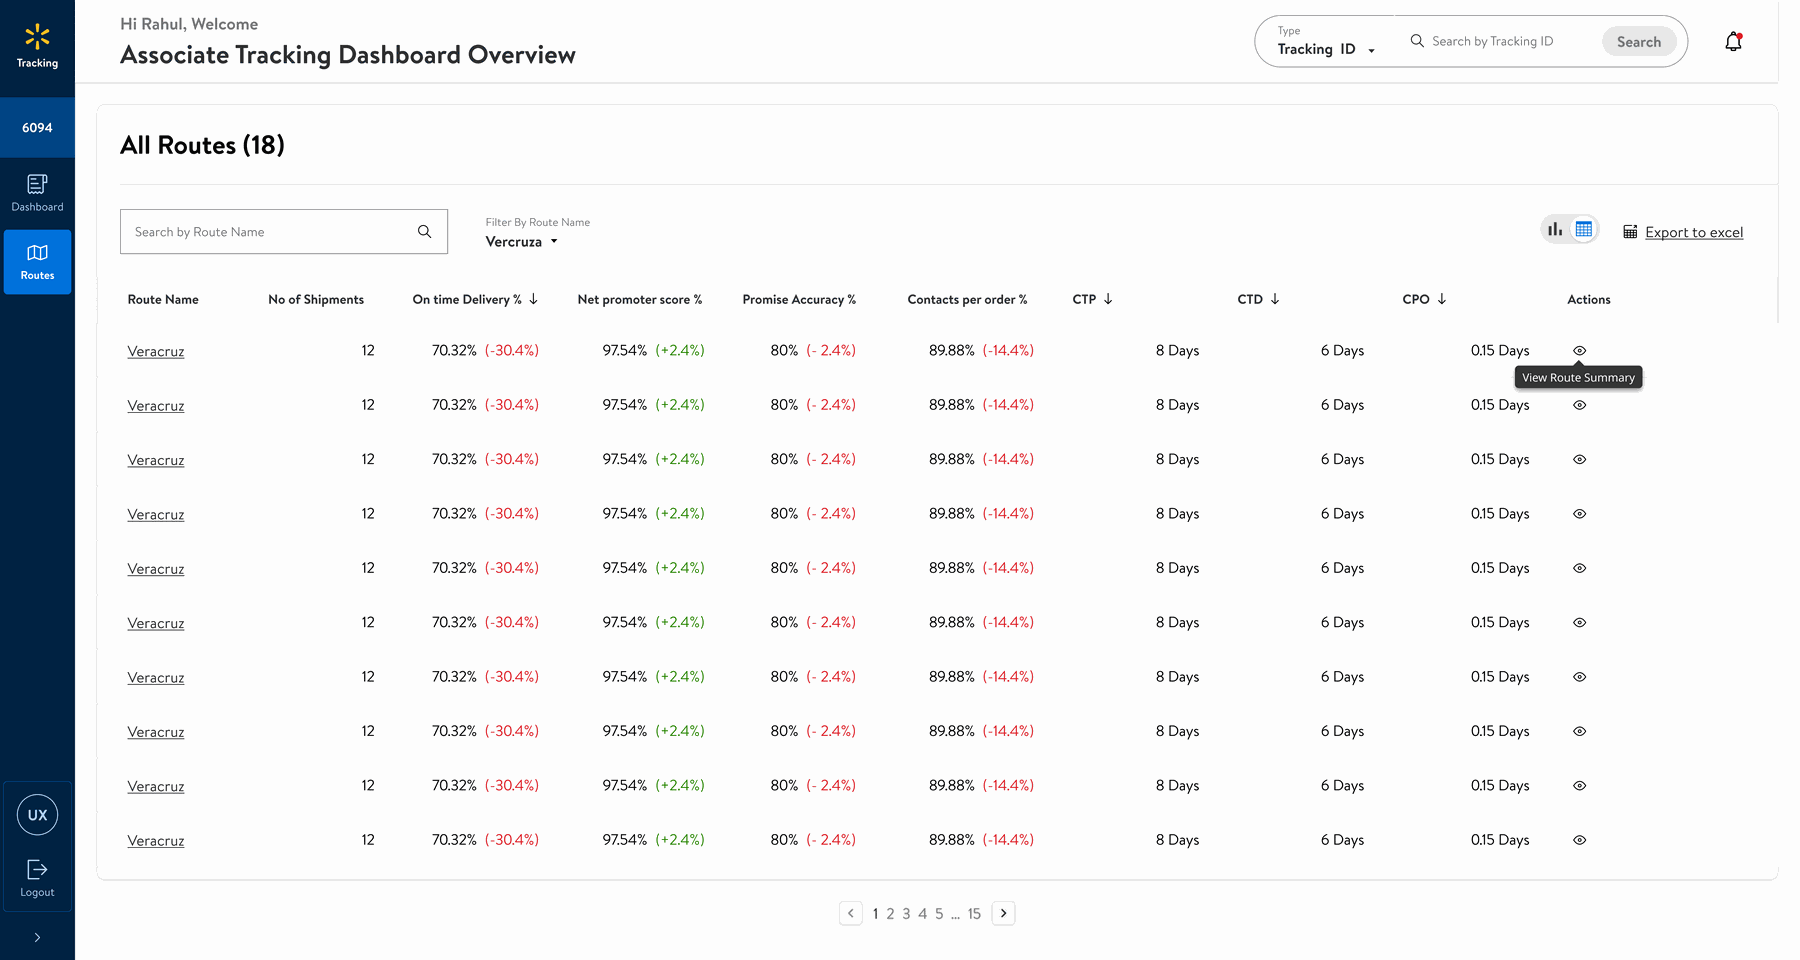
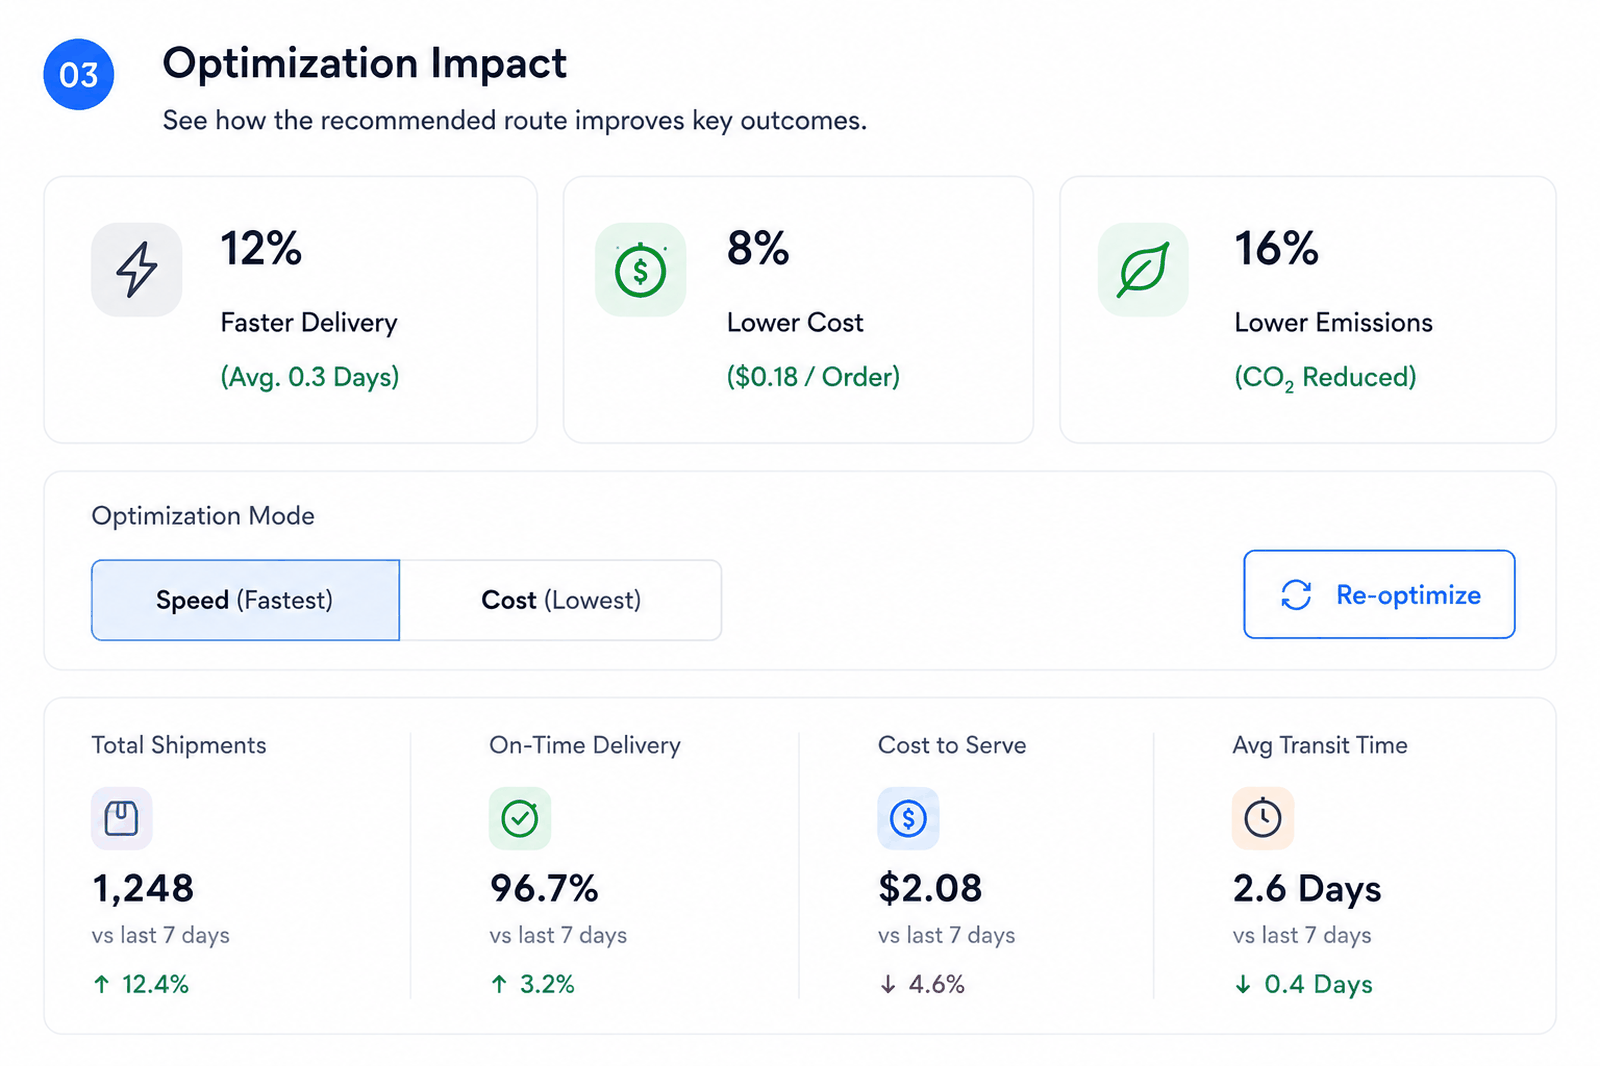
Visibility is the foundation. Optimization creates a path toward a more efficient multi-hop network.
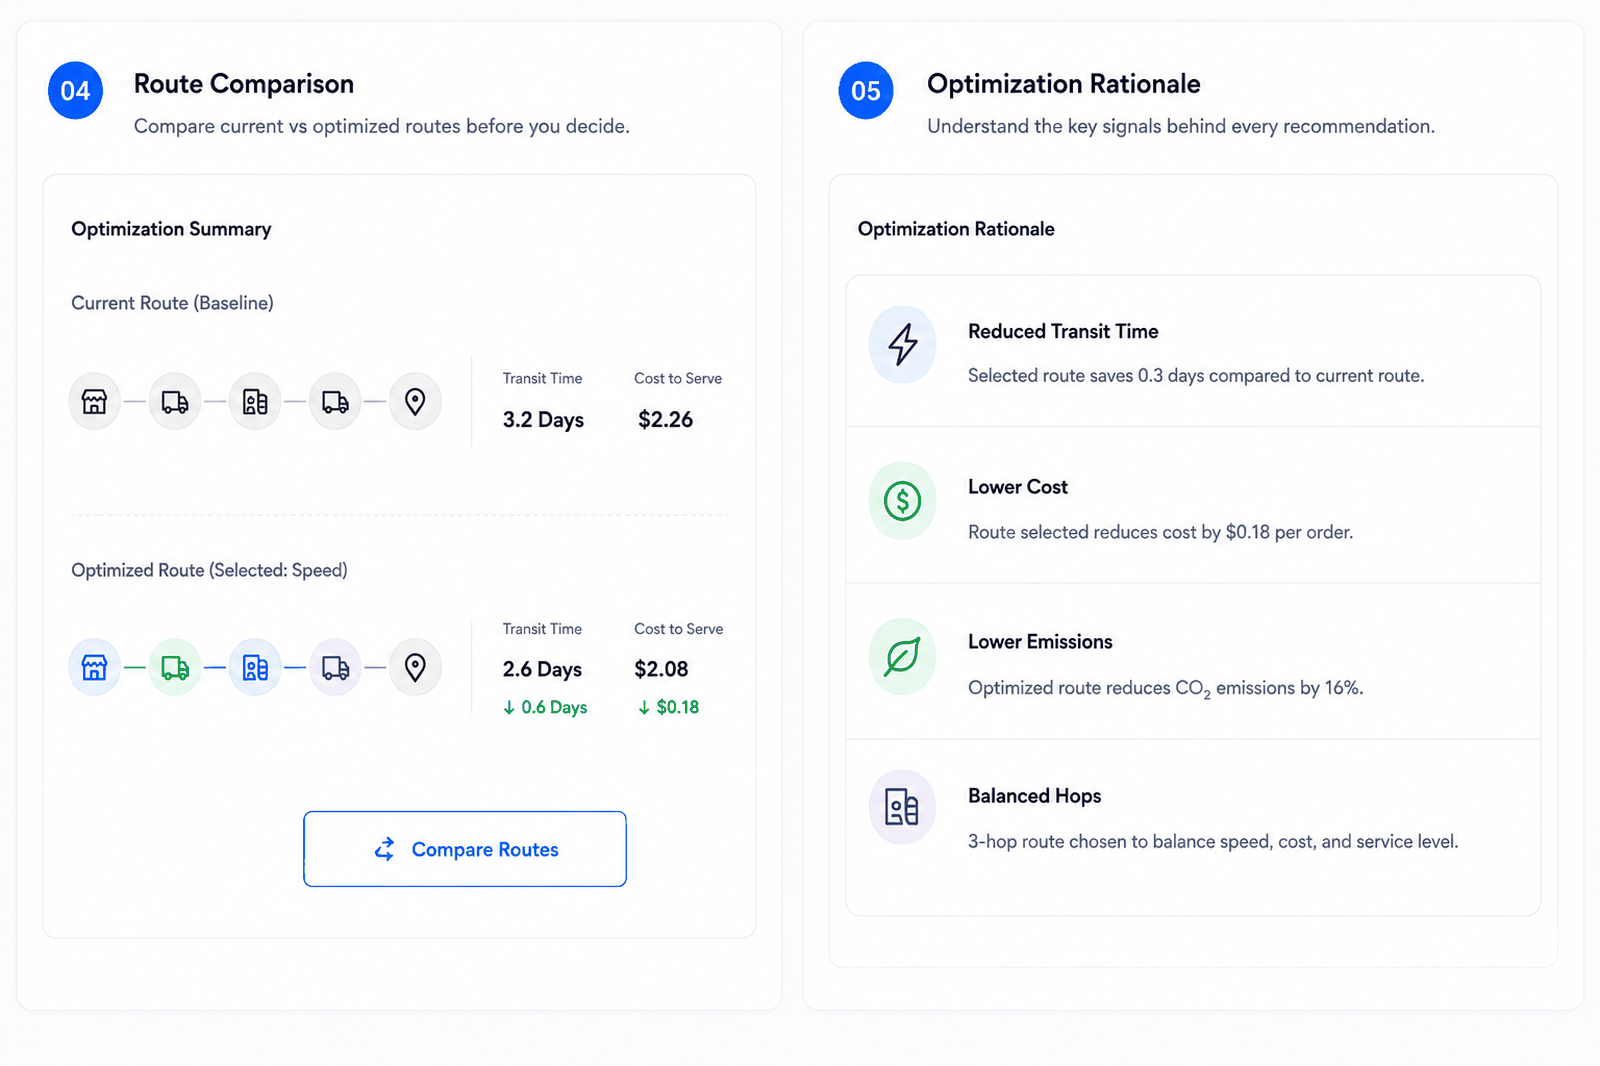
With shipment visibility across every handoff, this future-state concept explores how multi-hop optimization could compare routes across carriers and hops to improve speed, cost, and delivery performance.
Shipment visibility across omni-channel routes
Critical / ongoing / historical shipment views
Tracking ID and Order ID search
Operational filters and summary trail
Export to Excel
Multi-hop route comparison
Speed or cost optimization
Optimization rationale
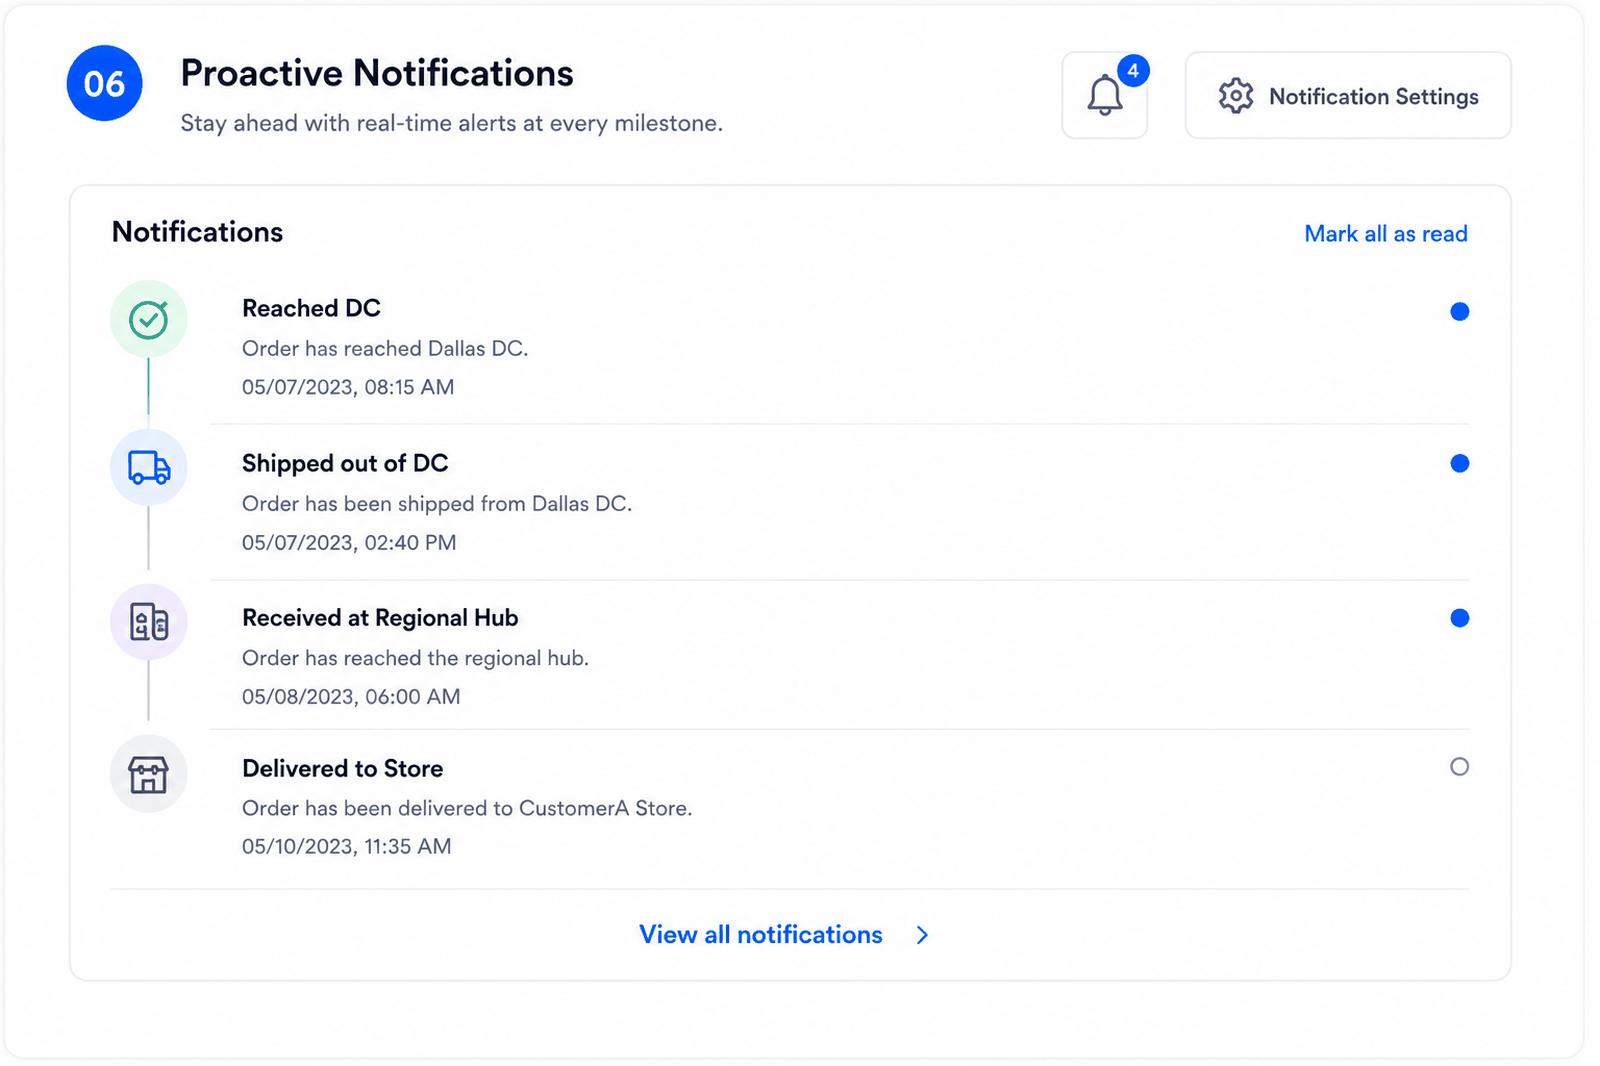
Proactive shipment notifications
Visibility across every handoff
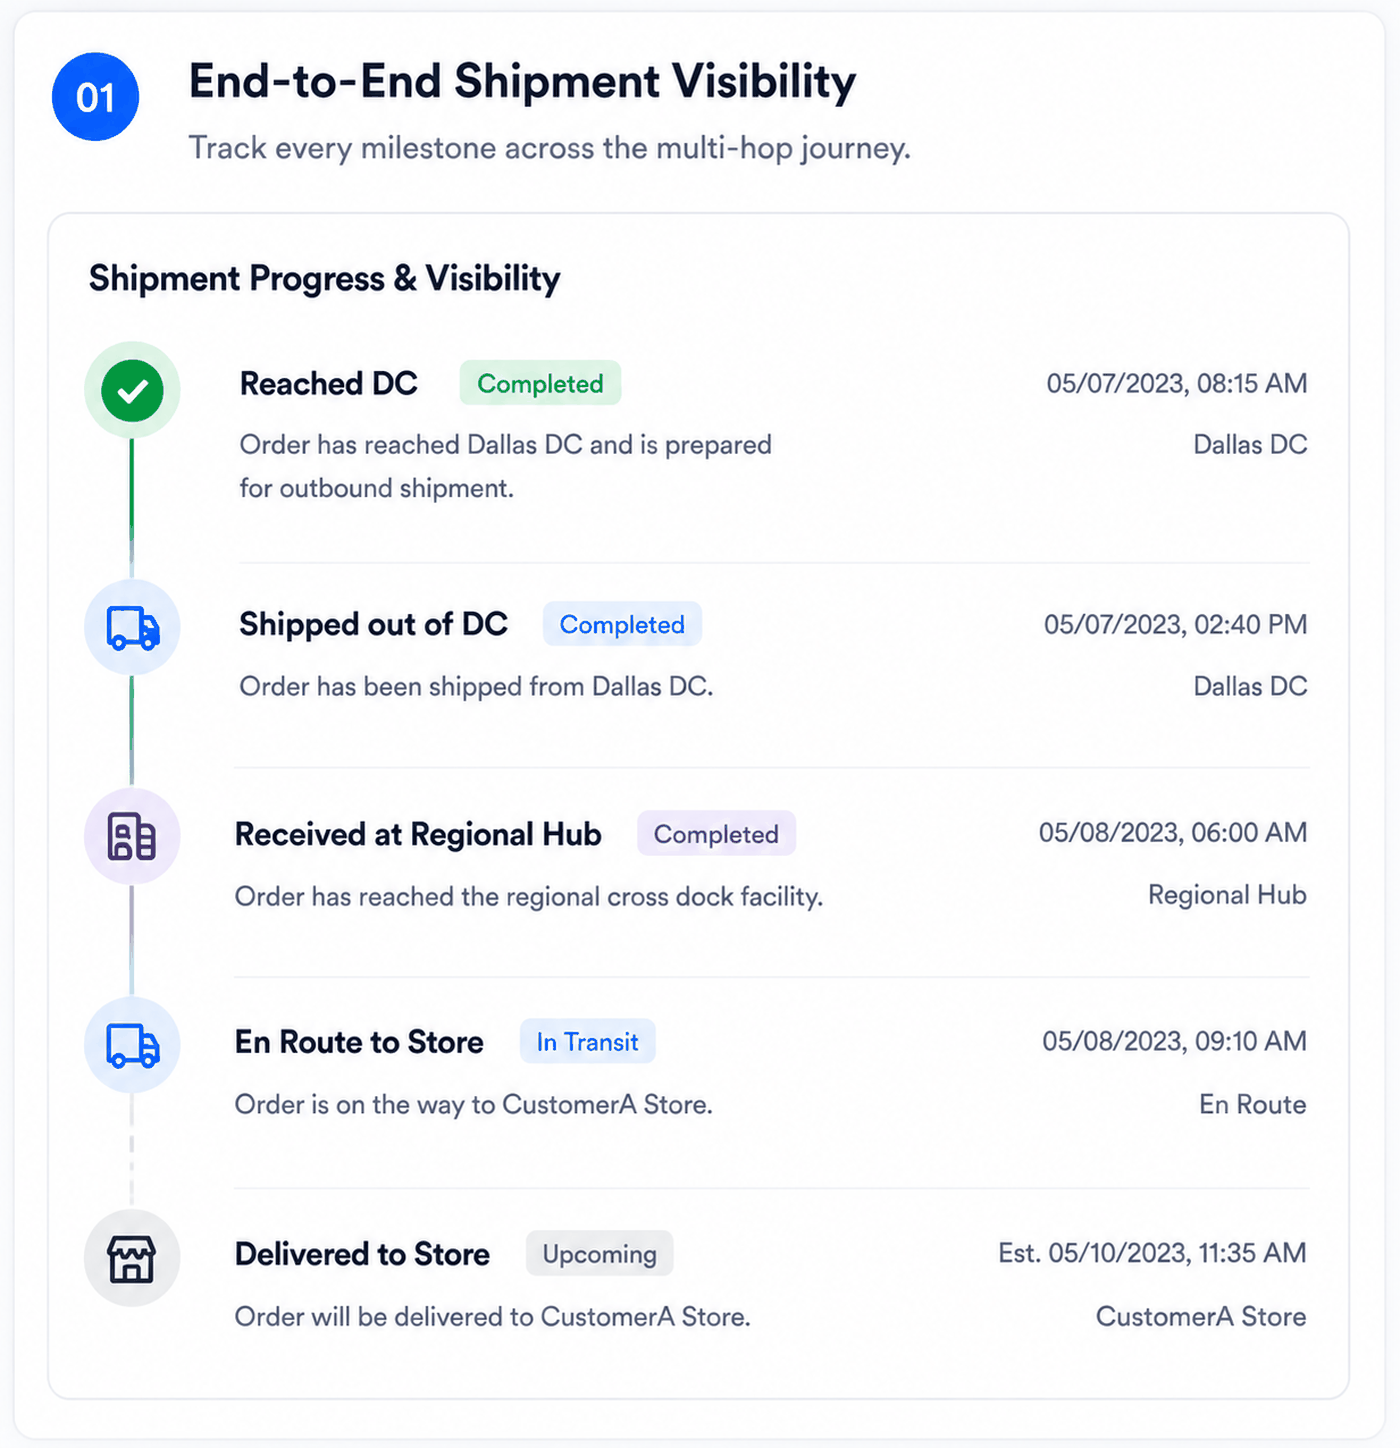
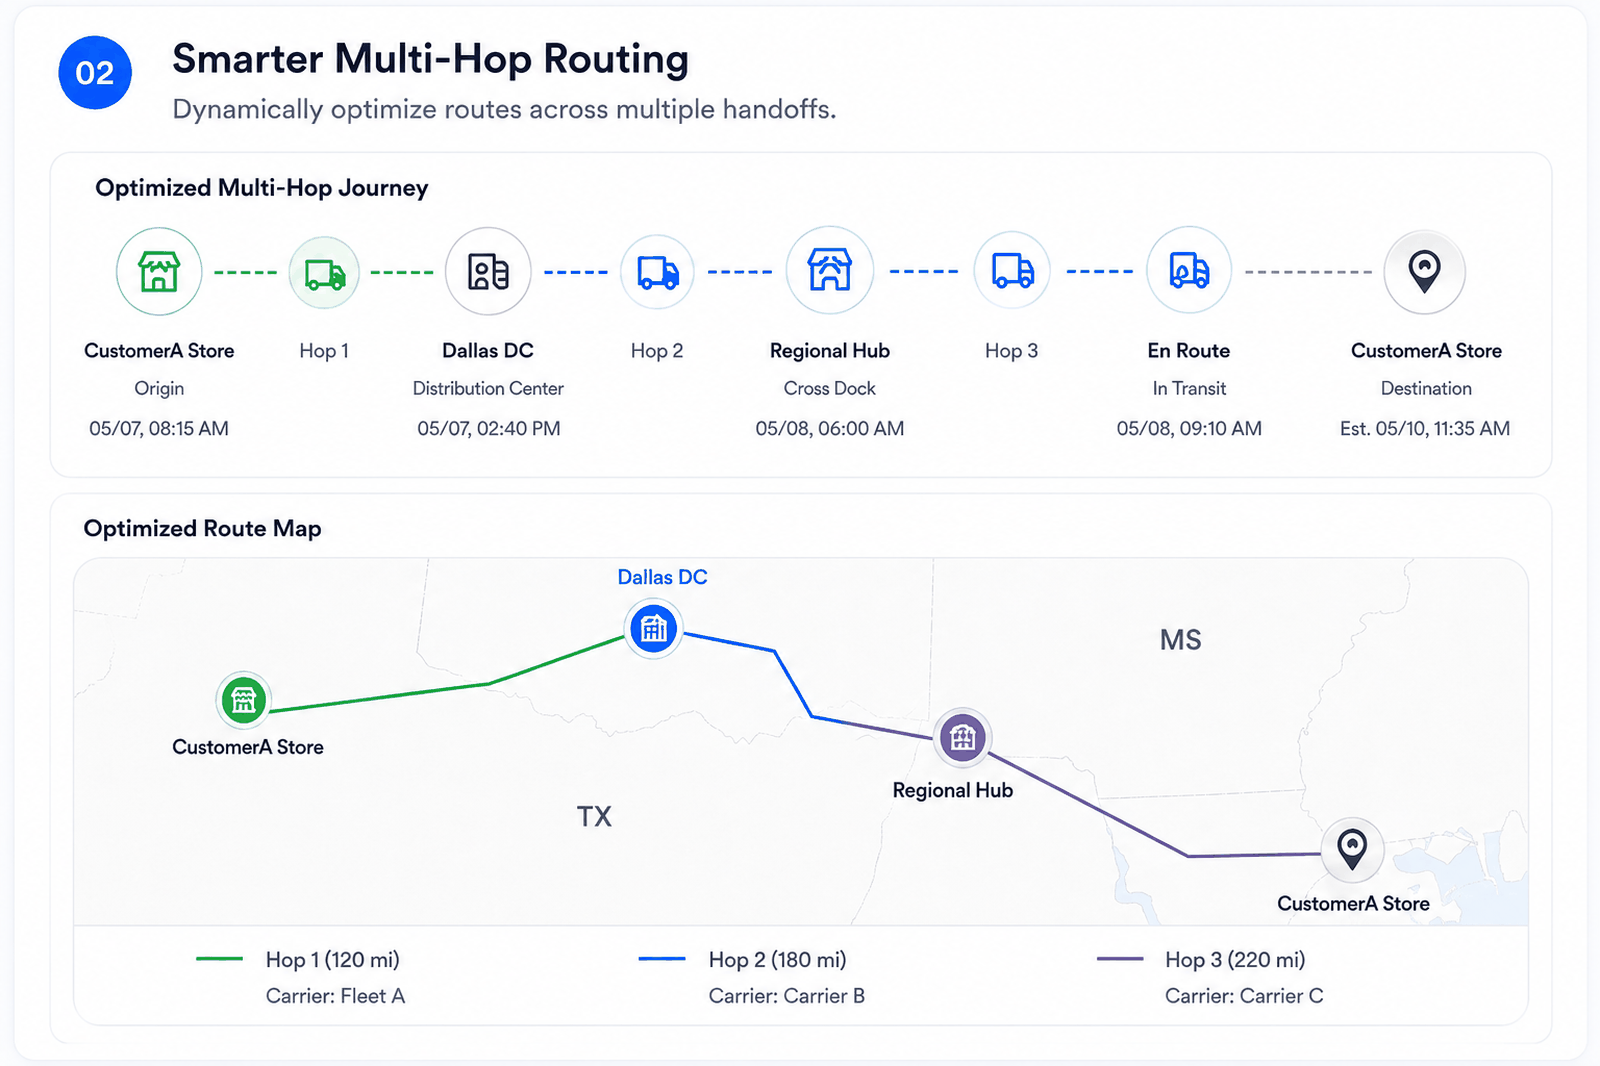
From visibility to optimization
This concept explores how shipment visibility could evolve into multi-hop route optimization.
Associates can see the complete shipment journey, receive notifications at key handoffs, and understand where an order is at any point.
Once that visibility is available, the experience could compare different routes — for example:
The system could compare delivery time, cost and number of hops, and explain why one route may be better.
Illustrative future POC — not shipped functionality.
The value is operational, not cosmetic: fewer places to look, less manual coordination, faster intervention.
By enabling visibility, operations can avoid adding people simply to manually track and prevent lost packages.
The work connected a complex operational problem to a clear experience strategy: make shipment state visible, give teams a shared source of truth, and create a foundation for route optimization.
"Enterprise UX is often about making invisible coordination visible."
What I'd push next: measure intervention time, exception resolution and customer-notification effectiveness.
From inventory insight to action.
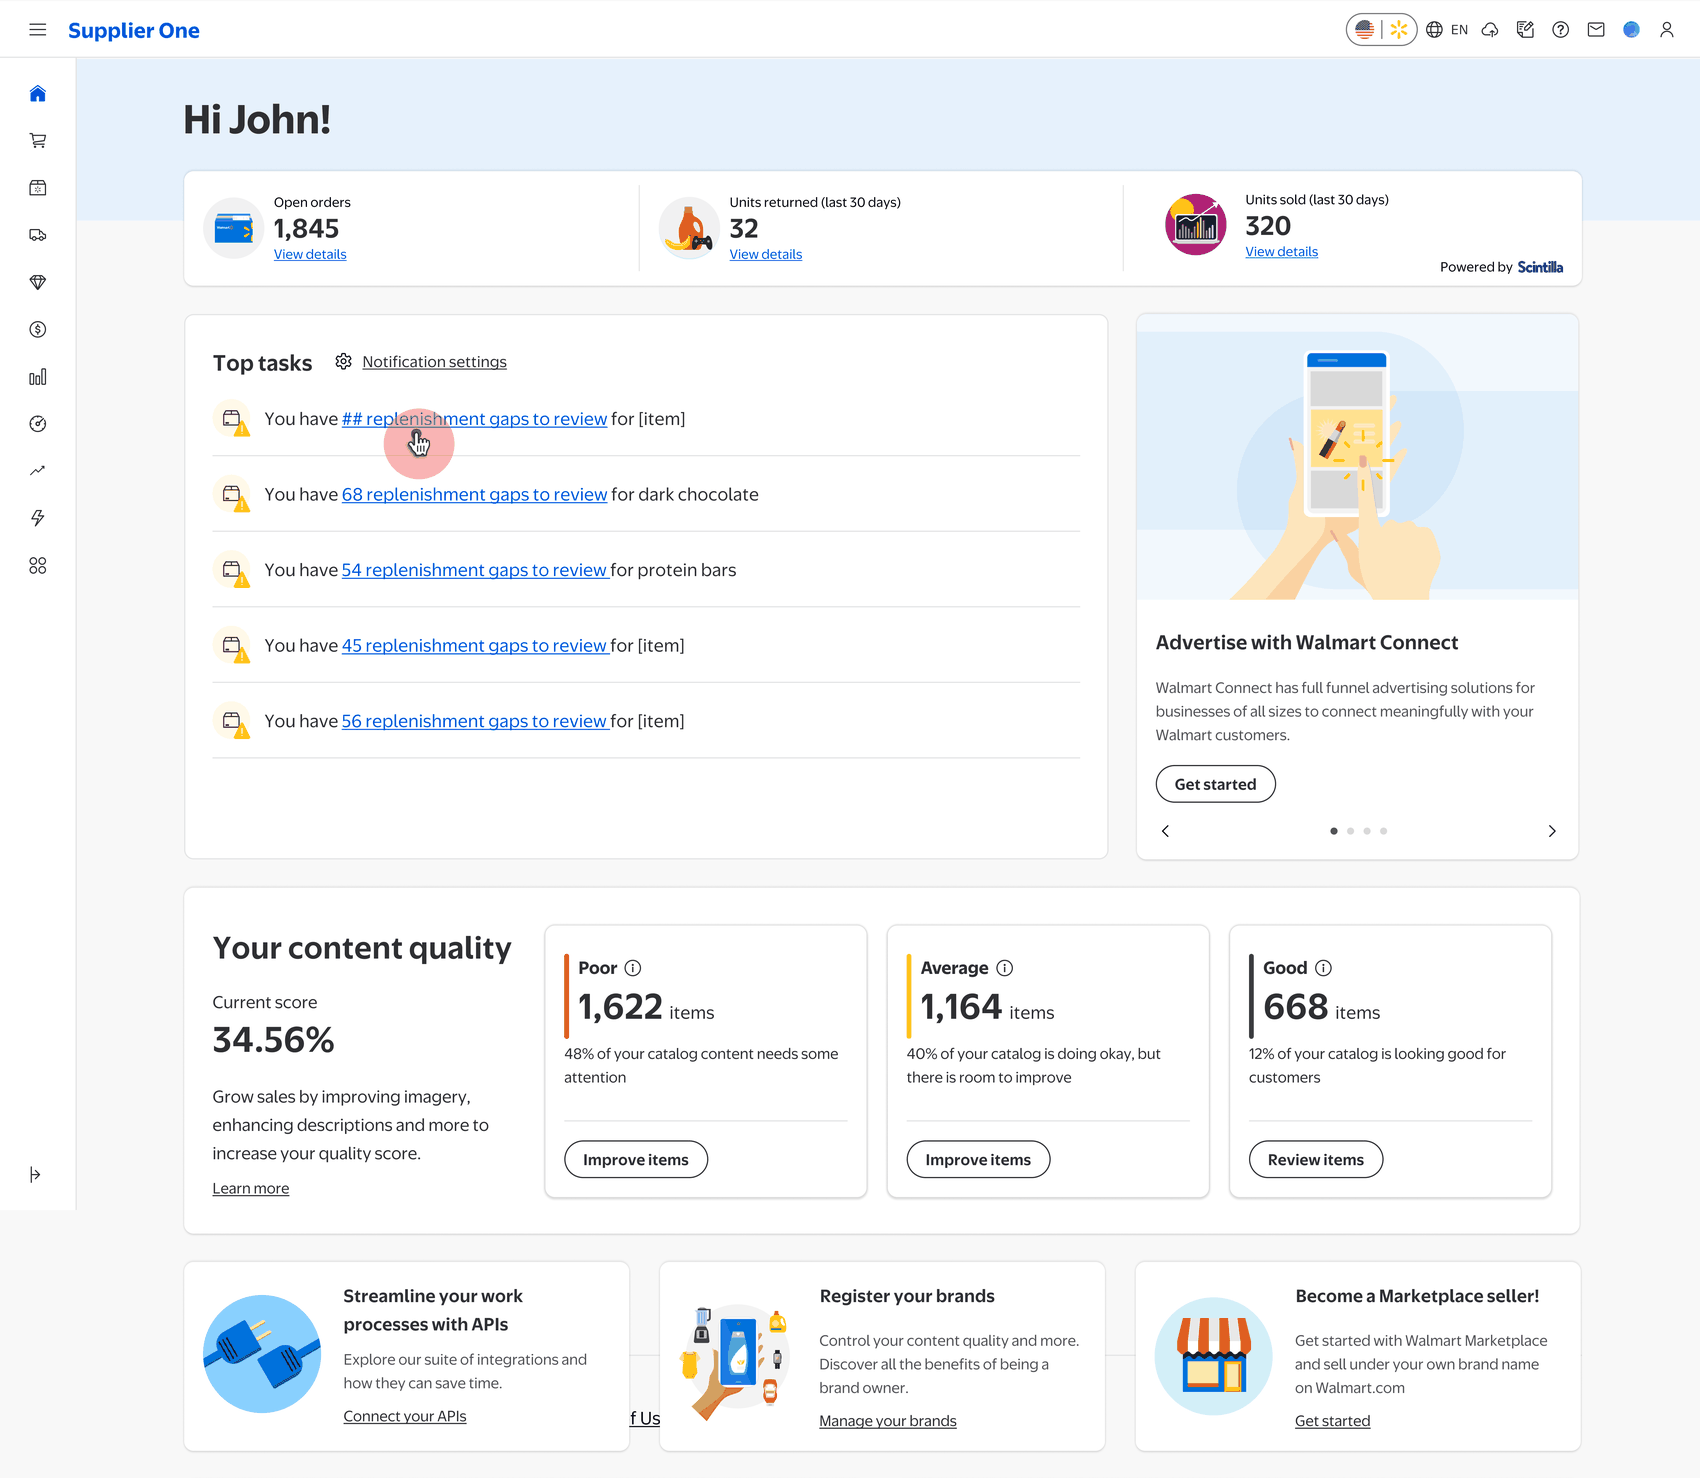
Connecting Scintilla In-stock Recommendations with Supplier One so suppliers can understand inventory risk, validate what is happening, and move directly into replenishment.
A recommendation should not end at insight.
The opportunity was to connect Scintilla's inventory intelligence with the workflow suppliers already use to replenish inventory. Instead of asking suppliers to interpret a signal and then find where to act, the experience brings the recommendation into Supplier One and carries it through toward execution.
Inventory availability
Help suppliers understand inventory risk, affected products, and the reasons behind an opportunity.
Suppliers
Surface the right issue early and provide enough context to decide what action is appropriate.
Scintilla + Supplier One
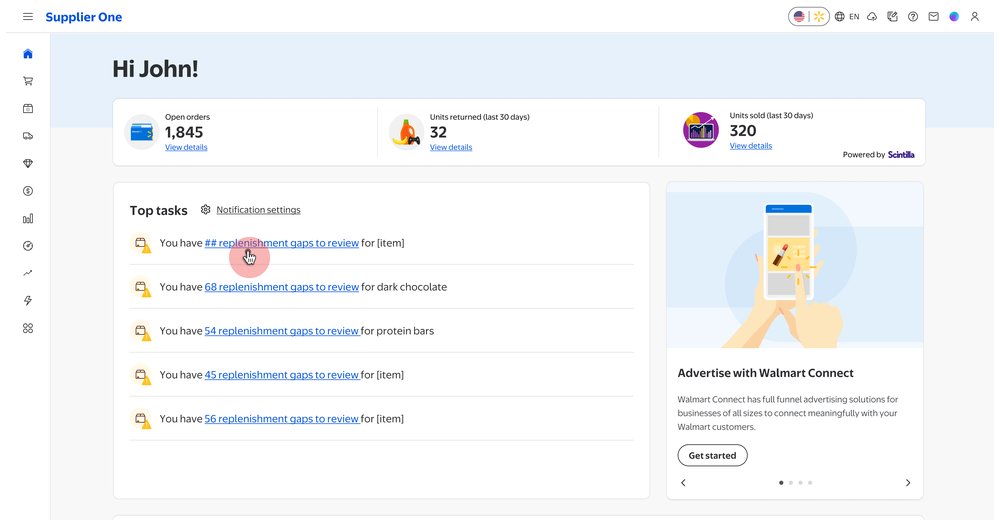
Bring In-stock Recommendations into Supplier One as a microfrontend within Top Tasks.
Recommendation → action
Measure whether opened recommendations lead to meaningful supplier action.
Reduce the distance between identifying an inventory risk and taking replenishment action — while helping protect in-stock performance and sales.
Suppliers spend more time finding problems than solving them.
Inventory issues were spread across multiple applications and reports. Suppliers had to investigate manually, connect the dots themselves, and then switch into another workflow to act. The core problem was not a lack of data; it was the distance between a signal and a confident next step.
Fragmented inventory signals
Information and signals were spread across tools.
One connected recommendation
Bring the relevant signal into Supplier One where it can be understood and acted on.
Manual investigation
Suppliers had to determine what mattered and gather context themselves.
Prioritized attention
Use Top Tasks to surface high-priority replenishment opportunities early.
Data without enough context
A signal alone did not explain severity, causes, or what to do next.
Explainable recommendations
Show business impact, root causes, contributing factors, and supporting evidence.
Insight separate from execution
Suppliers had to leave the analysis experience to create or submit an order.
Recommendation → action
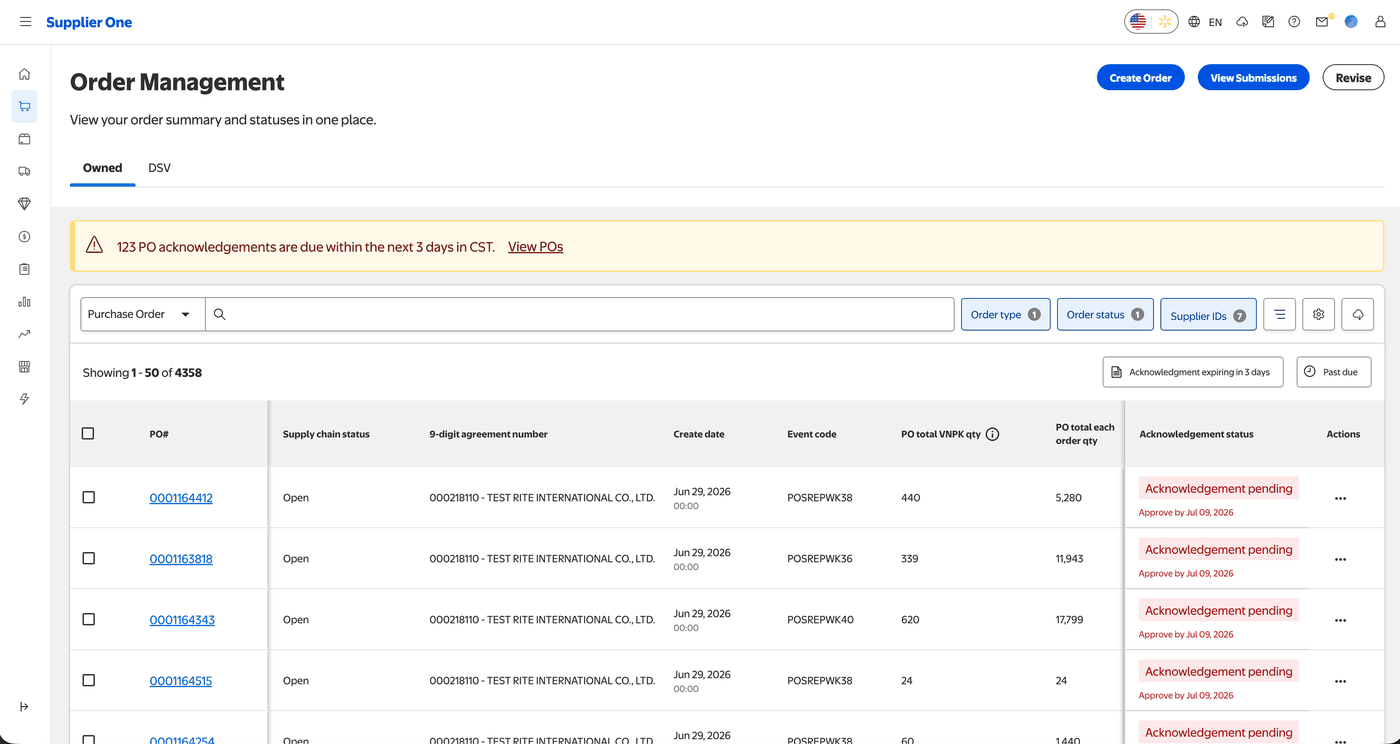
Connect the recommendation to a prefilled PO and Supplier One Order Management.
From finding inventory issues to acting on the right replenishment opportunity.
This case study is protected under NDA.
The full screens, design process, and product rationale are available to approved reviewers. Enter your password below, or request access for the complete walkthrough.
How might we surface actionable insights and recommendations to suppliers?
The design challenge was to make intelligence useful at the moment of decision: surface the issue, explain why it matters, establish confidence in the recommendation, and provide a direct path to execution.
ACTS — principles for actionable recommendations.
Capture Attention
Surface high-priority replenishment opportunities in Top Tasks so suppliers focus on the most impactful issues first.
Clear Causality
Explain why inventory gaps exist through root causes, contributing factors, and business impact before recommending an action.
Earn Trust
Build confidence with transparent metrics, evaluation methodology, and supporting evidence behind every recommendation.
Shareable for Action
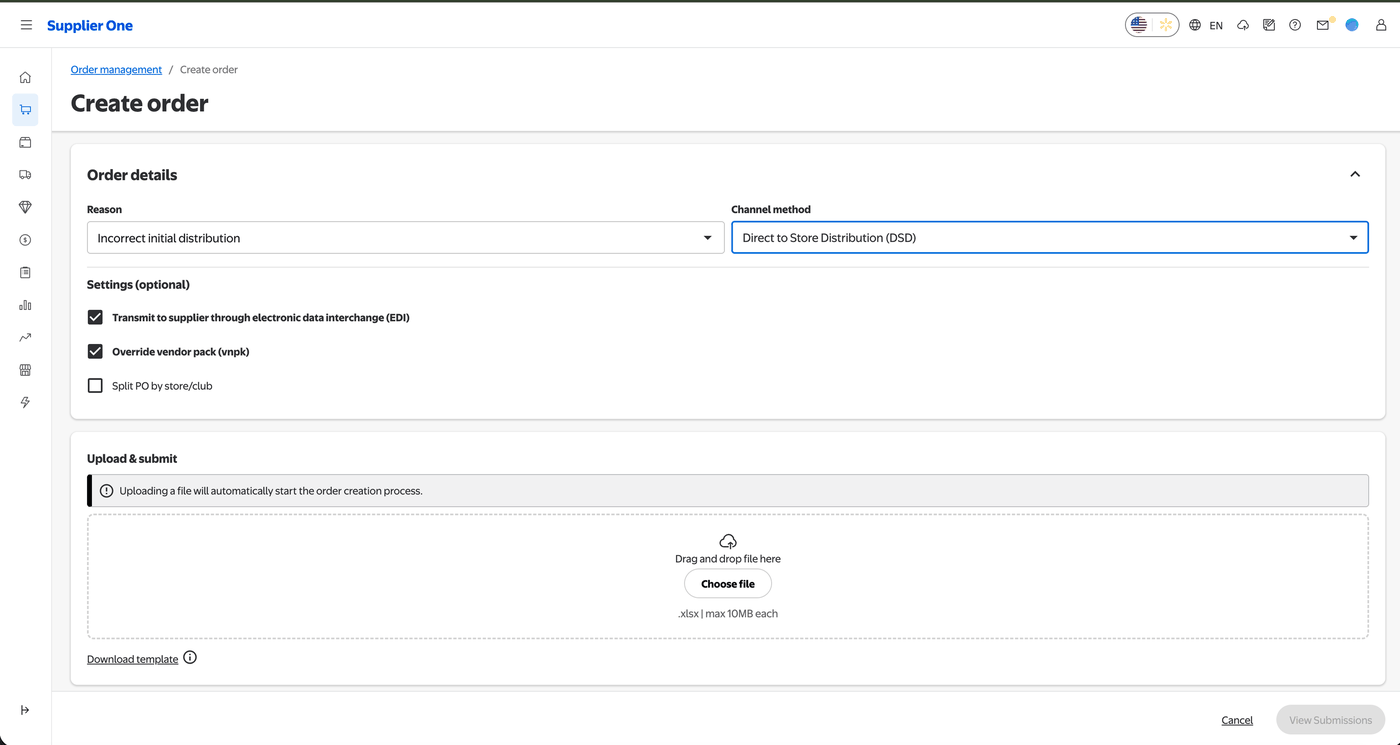
Enable suppliers to download prefilled Purchase Orders and continue directly to Supplier One Order Management.
I owned the experience strategy from insight to action.
I shaped the experience strategy and interaction model for connecting Scintilla's inventory recommendations with Supplier One — from discovery and recommendation comprehension through to replenishment action.
Experience strategy · interaction model · information architecture · recommendation experience · integration flow · prototype validation
Bring Scintilla recommendations into Supplier One.
The final decision was to surface the Scintilla In-stock Recommendations experience as a microfrontend (MFE) within Supplier One's Top Tasks, then connect suppliers directly to Order Management to complete replenishment.
The design had to preserve Supplier One's existing workflow while making Scintilla's intelligence feel native to the experience.
See the recommendation
See a personalized replenishment recommendation proactively in Top Tasks.
Review the evidence
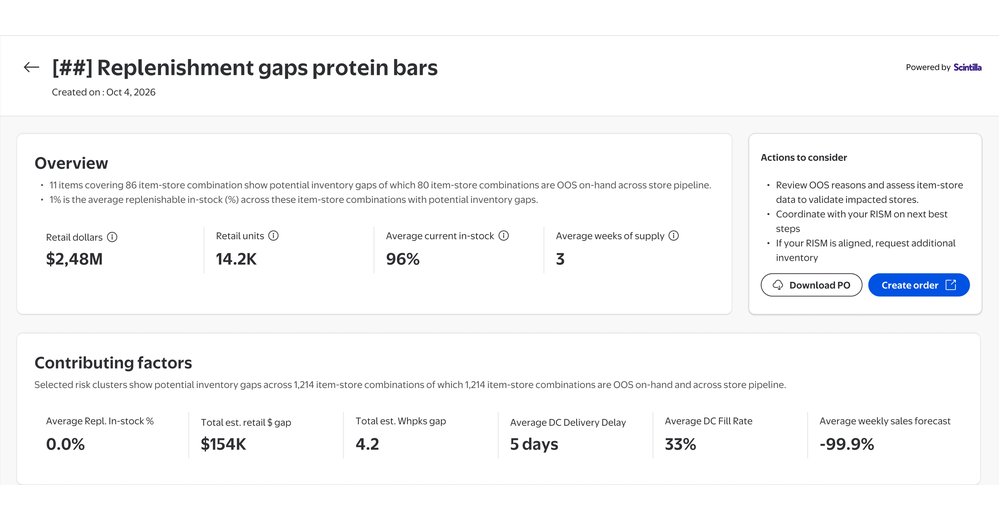
Review business impact, inventory gaps, root causes, and contributing factors.
Validate
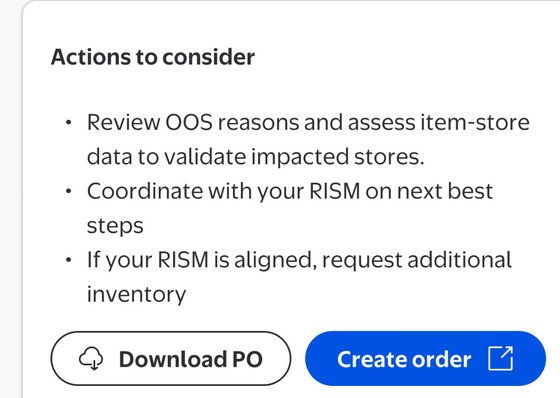
Validate the recommendation using supporting data and coordinate with RISM when needed.
Move to order
Download a prefilled PO or continue directly to Supplier One Order Management.
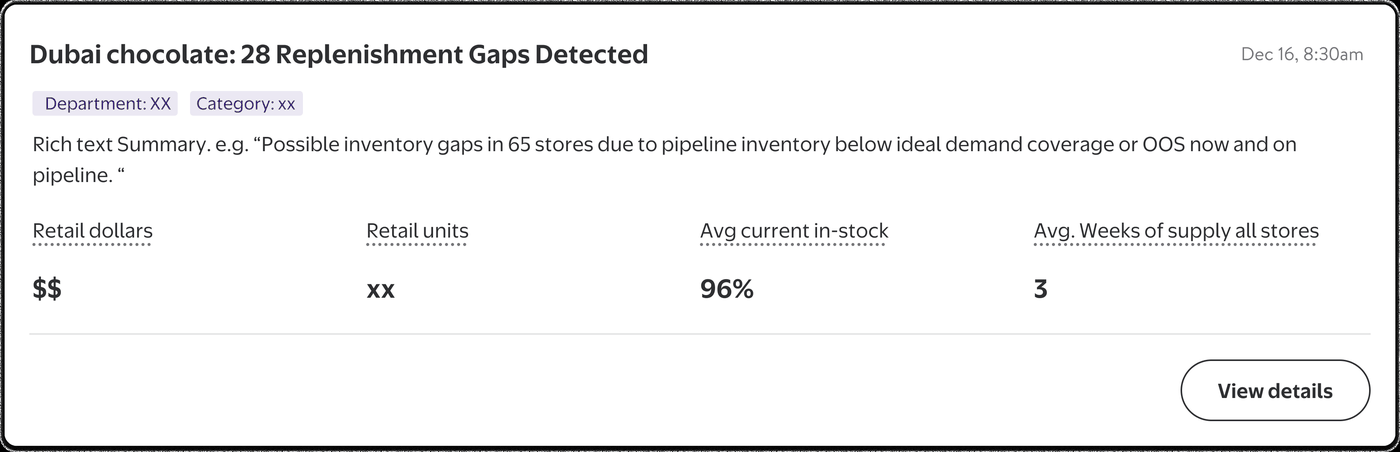
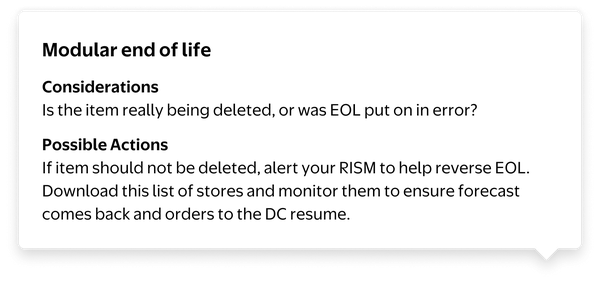
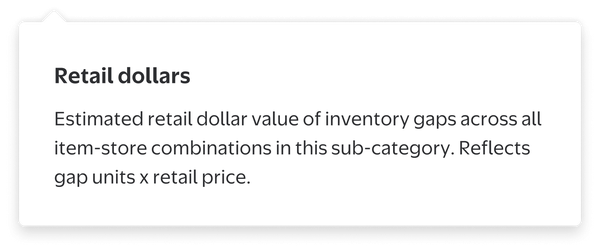
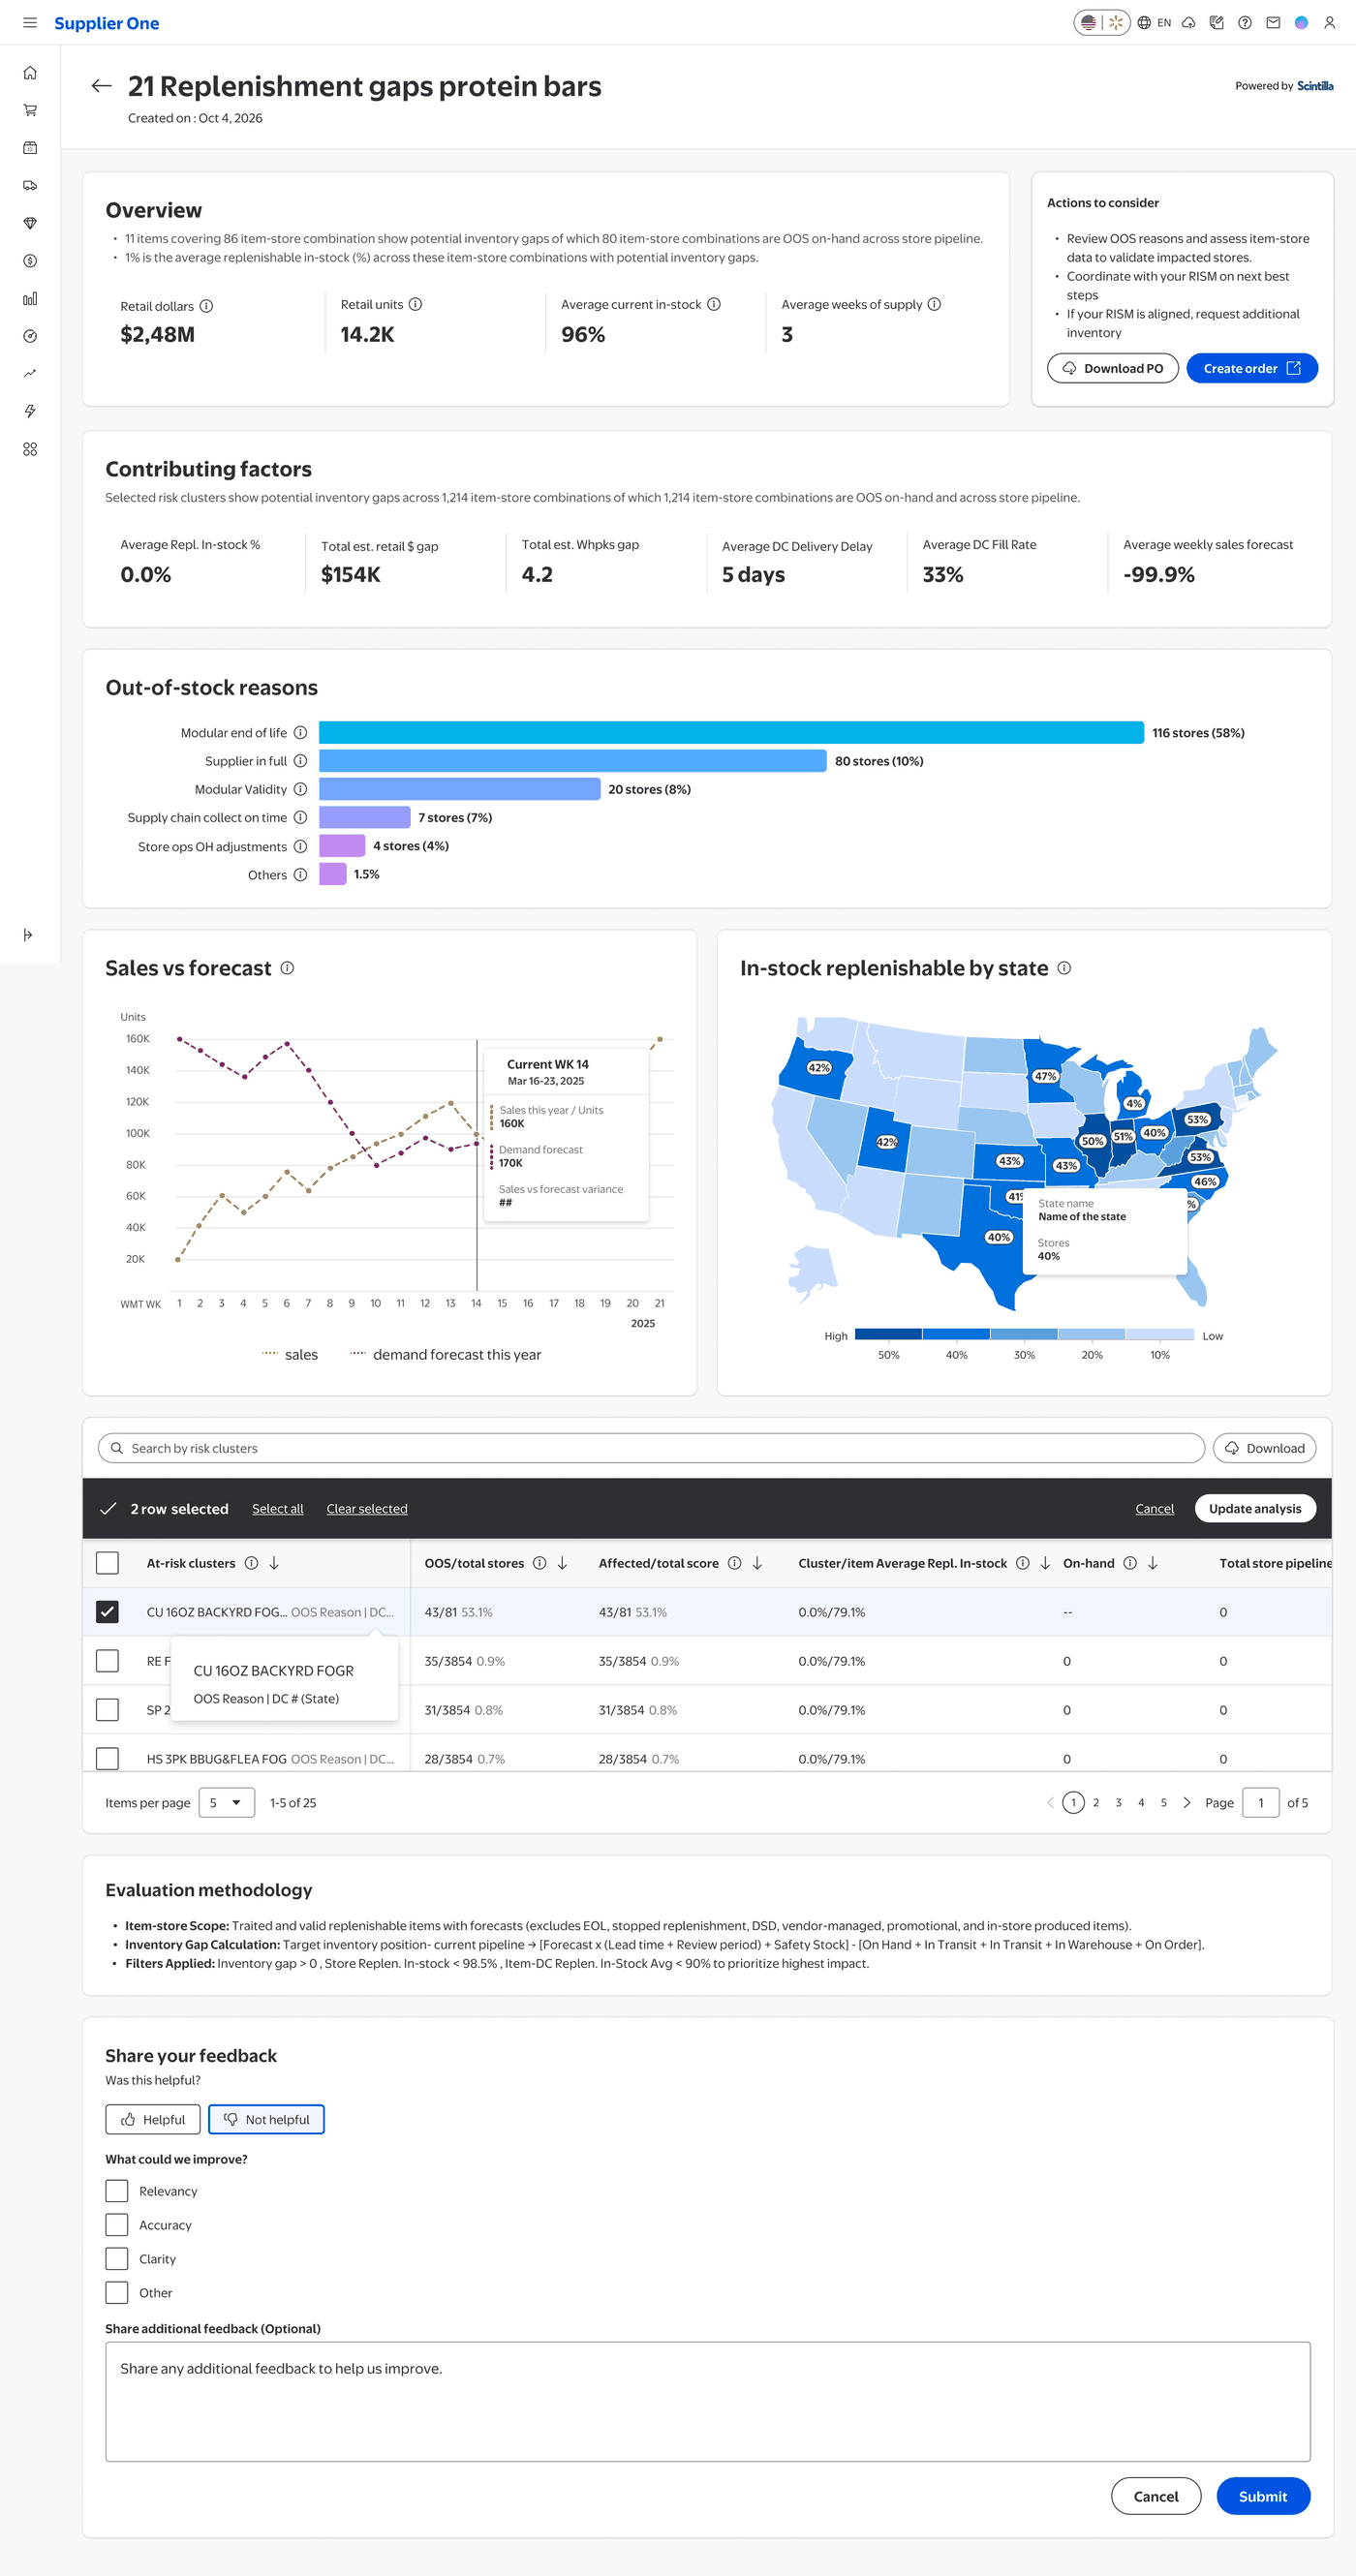
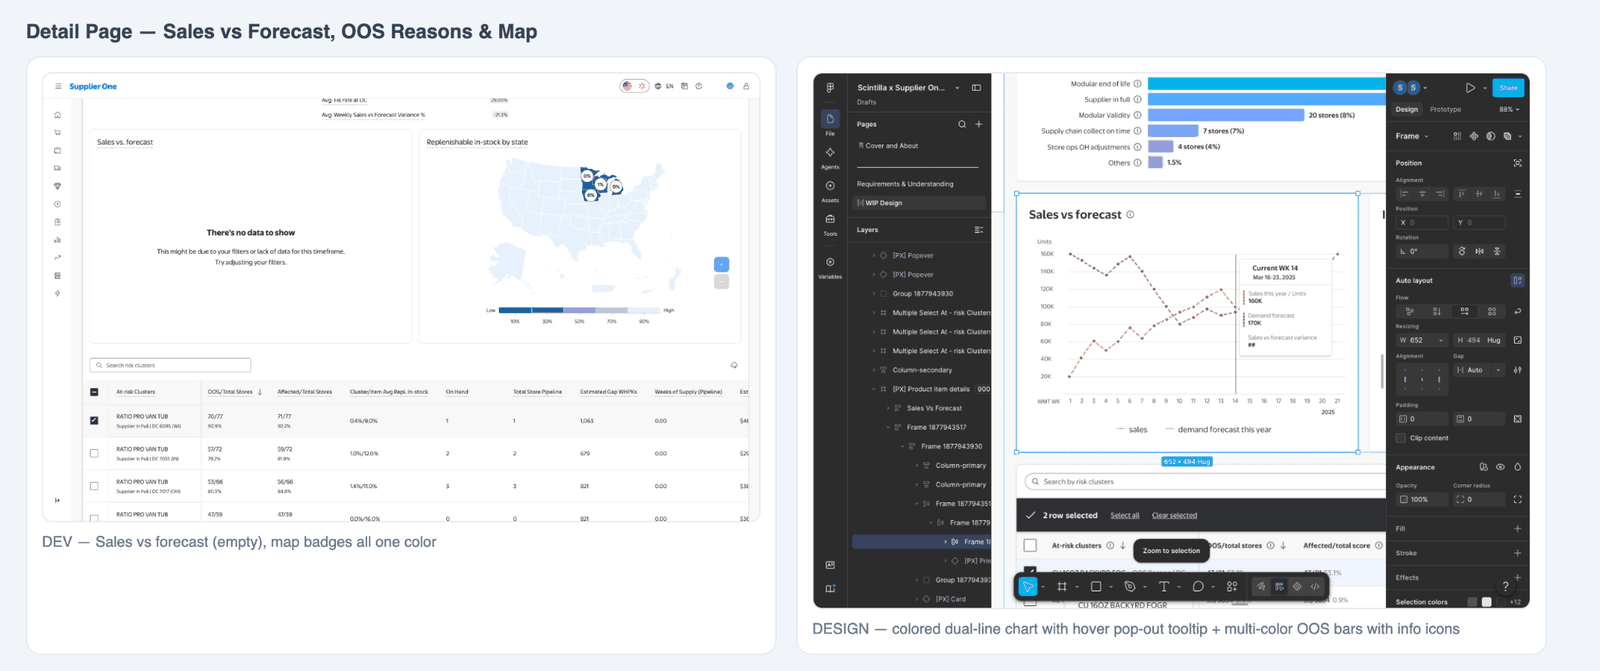
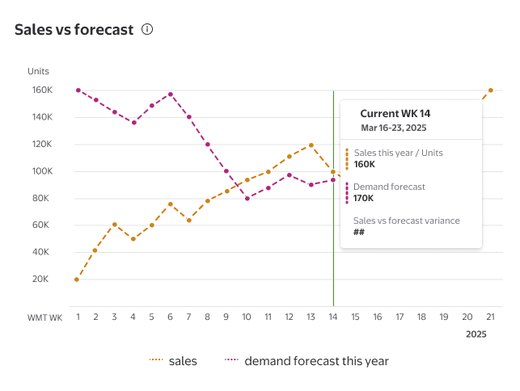
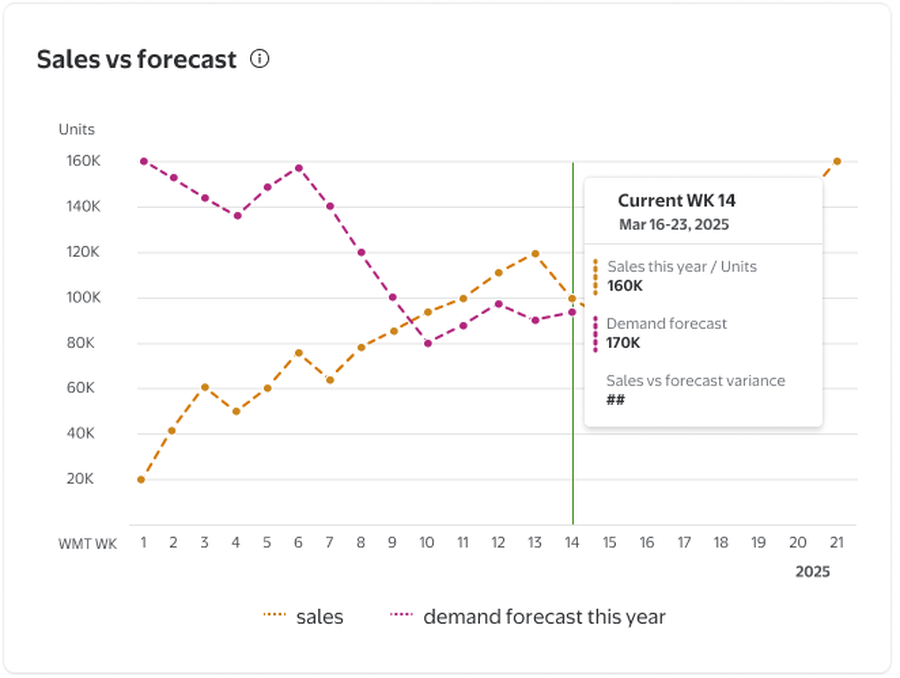
Are sales meeting demand?
Comparing this year's sales against the demand forecast shows whether the gap is a supply problem or a demand shift — informing better replenishment planning.
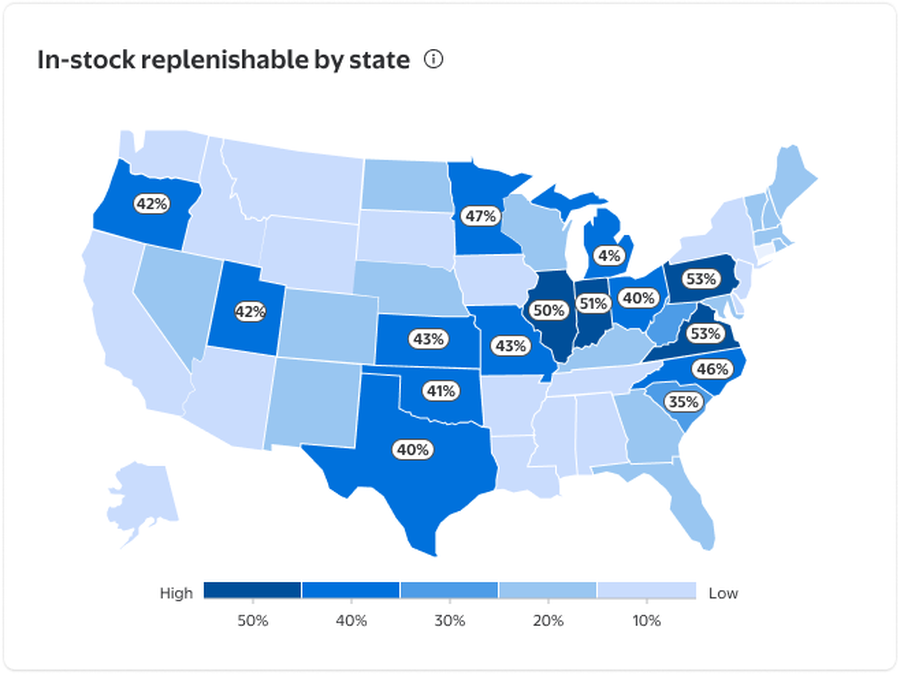
Where are the inventory gaps?
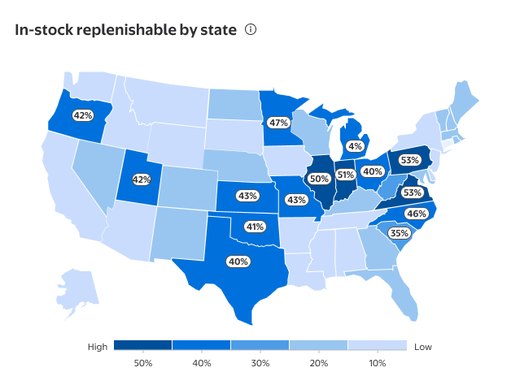
A state-level view of in-stock replenishable inventory helps suppliers prioritize which regions to act on first.
Move execution closer to the moment of decision.
The key shift was moving execution into the recommendation journey rather than treating it as a separate workflow.
Give every recommendation enough context to support a decision.
The experience was structured around four questions a supplier needs answered before acting: what is at stake, what changed, what needs attention, and why the recommendation can be trusted.
What is at stake?
Retail sales impact, units affected, in-stock percentage, and weeks of supply help frame issue severity.
Is demand changing?
Compare actual sales with forecast to understand whether demand changes contributed to the inventory gap.
What needs attention?
Drill into affected products, clusters, stores, and inventory levels to prioritize what should be investigated.
Why was this recommended?
Show how calculations and recommendation logic were generated so suppliers can trust the result.
From action to design intent.
Analyze why products are unavailable at stores, such as supplier delays, low inventory, forecasting errors, or logistics issues.
Explain why the issue happened so suppliers can determine the appropriate response.
Work with the Walmart Replenishment Inventory Solutions Manager when the issue requires collaboration or validation.
Create a path to validate the recommendation and agree on the replenishment plan.
Download a pre-filled Purchase Order template containing recommendation data, then review or update it before submission.
Remove the need to create the order from scratch.
Continue to Supplier One Order Management to upload the completed PO and request inventory replenishment.
Make the primary call to action a direct move from recommendation to execution.
One journey from signal to replenishment.
Top Task → Recommendation → Business impact → Root cause → Decision → PO / Order Management. The flow was designed so the supplier always understands what changed, why it matters, and what to do next.
Reduce the cognitive work between knowing and doing.
The experience shift is not simply a UI consolidation. It changes the supplier's job from assembling evidence across systems to evaluating a recommendation with the right context and moving into the existing execution workflow.
Measure whether insight actually changes behavior.
The Supplier One experience is pre-launch, so these are success targets and measurement signals, not achieved results.
Success isn't just surfacing better insights. It's shortening the distance between insight and action.
"The value of intelligence is realized only when it is connected to the workflow where decisions become actions."
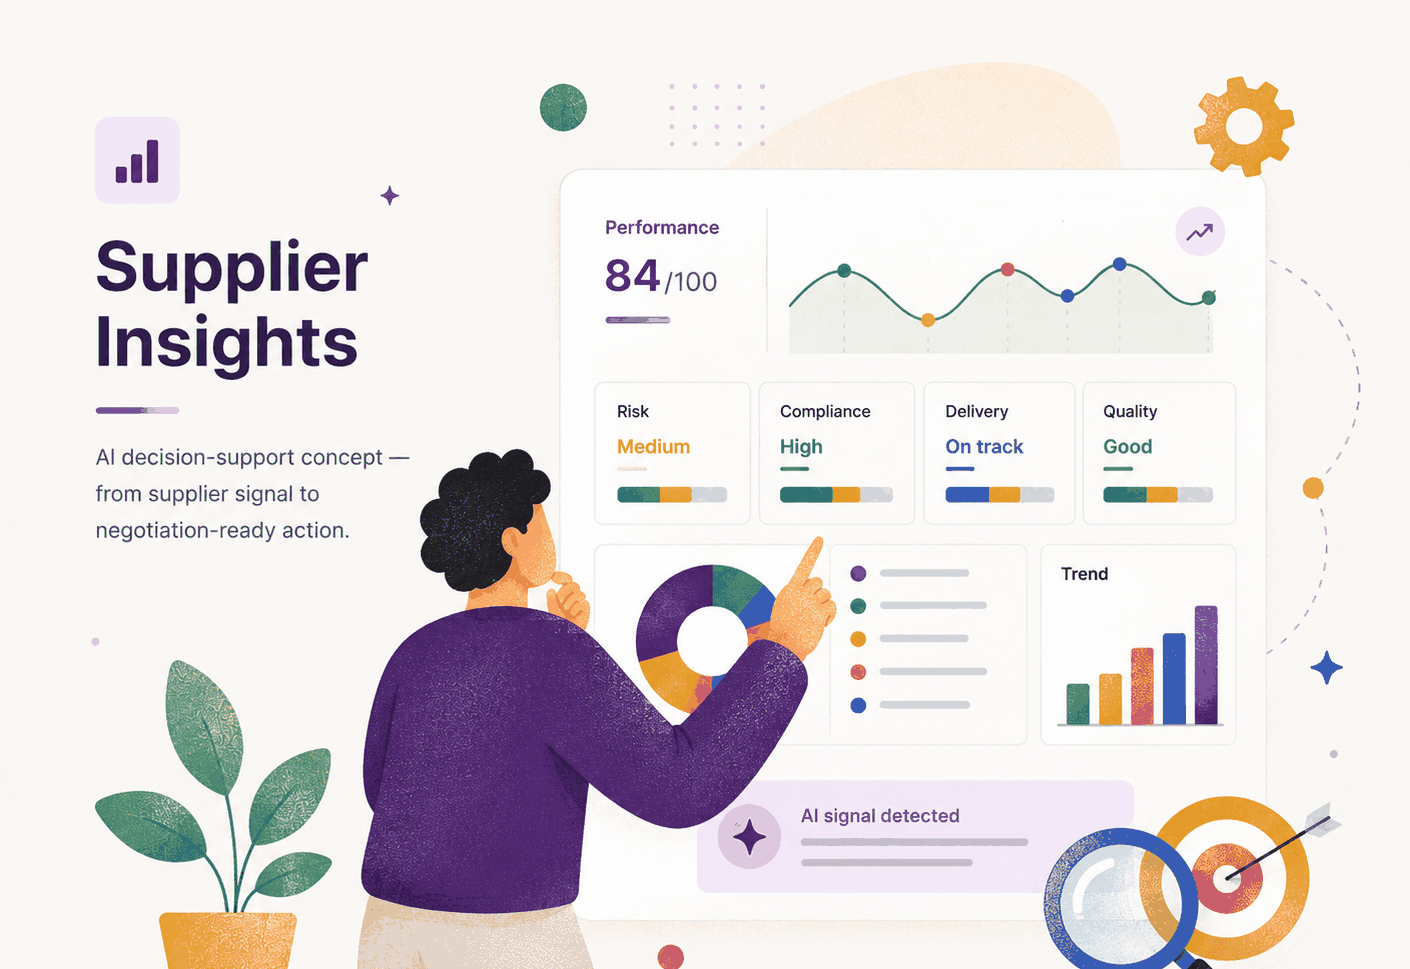
Meet Surety — the AI that turns a quiet signal into a negotiation-ready plan.
A decision-support concept for Supplier Matrix. Surety watches supplier performance, prices out the exposure the moment something slips, lines up a vetted alternative and drafts the terms — so a sourcing manager can act in minutes instead of investigating for days. The merchant still makes the call.
AI proposes. The merchant decides. Surety surfaces the evidence, the exposure and a recommended path — the final supplier decision, volume shift and negotiation stay with the merchant.
Detect
Quantify
Compare
Decide
Extend
This case study is protected under NDA.
The full screens, design process, and product rationale are available to approved reviewers. Enter your password below, or request access for the complete walkthrough.
Supplier intelligence was everywhere. The decision path wasn't.
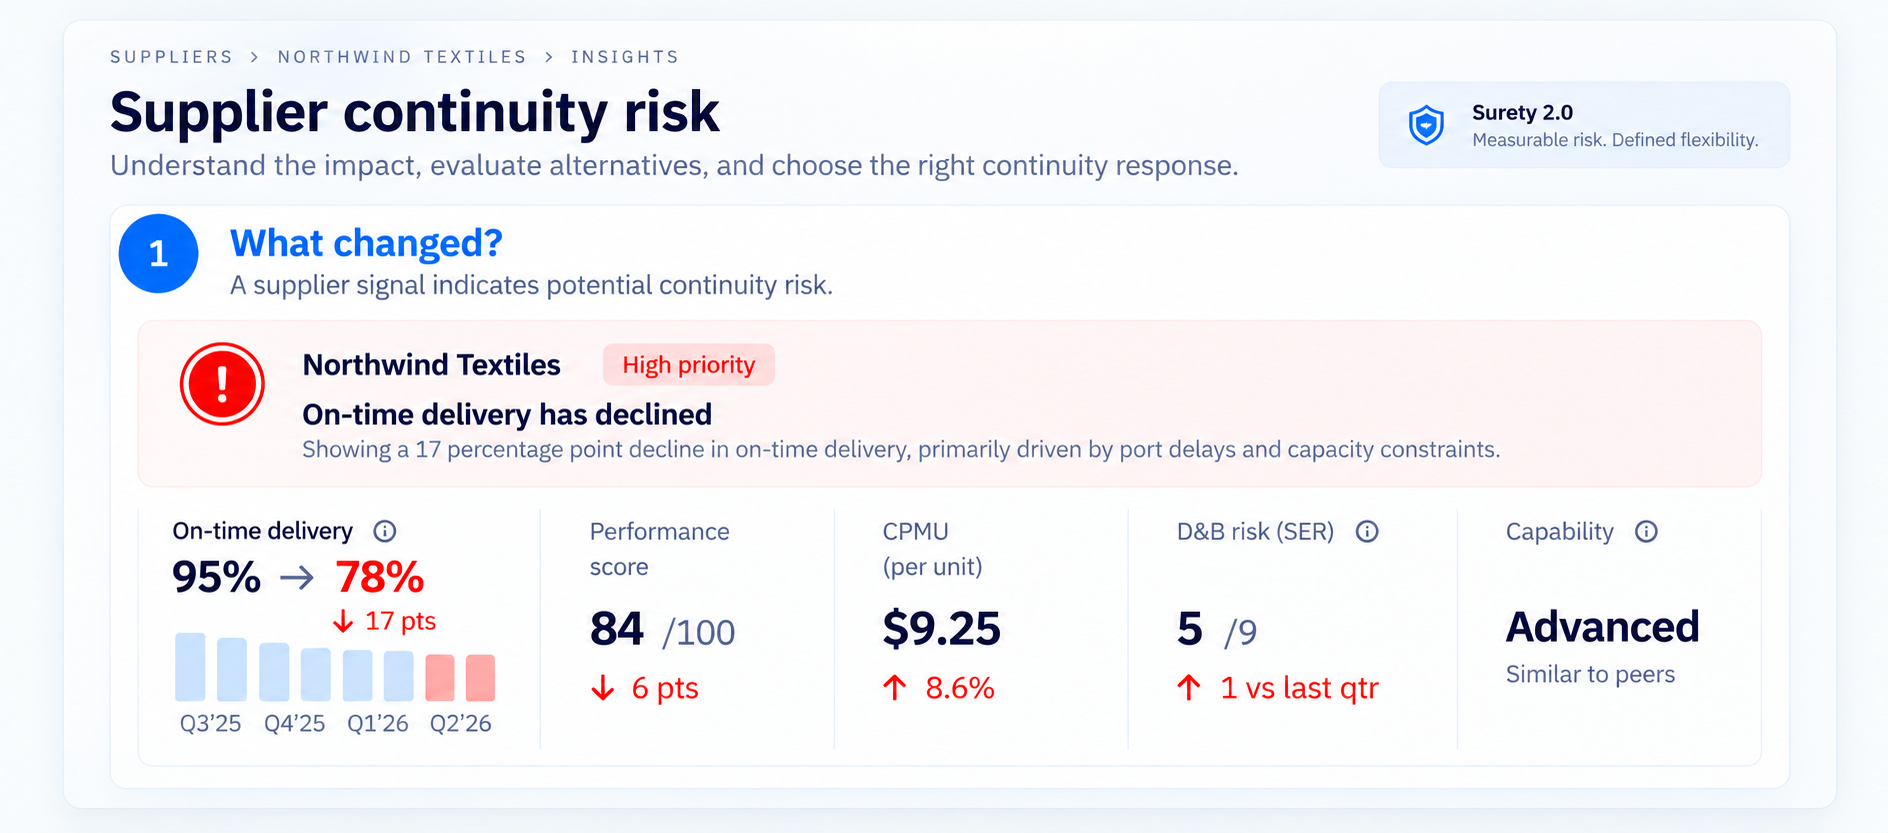
Performance, cost, risk, capacity and capability signals already existed inside Supplier Matrix — down to metrics like . But turning a warning sign into a decision meant a sourcing manager manually connecting all of it, then estimating impact, sourcing alternatives and building a case, usually under deadline pressure.
A supplier is quietly slipping.
On-time delivery falls from 95% → 78% — a decline easy to miss between dashboards until it's urgent.
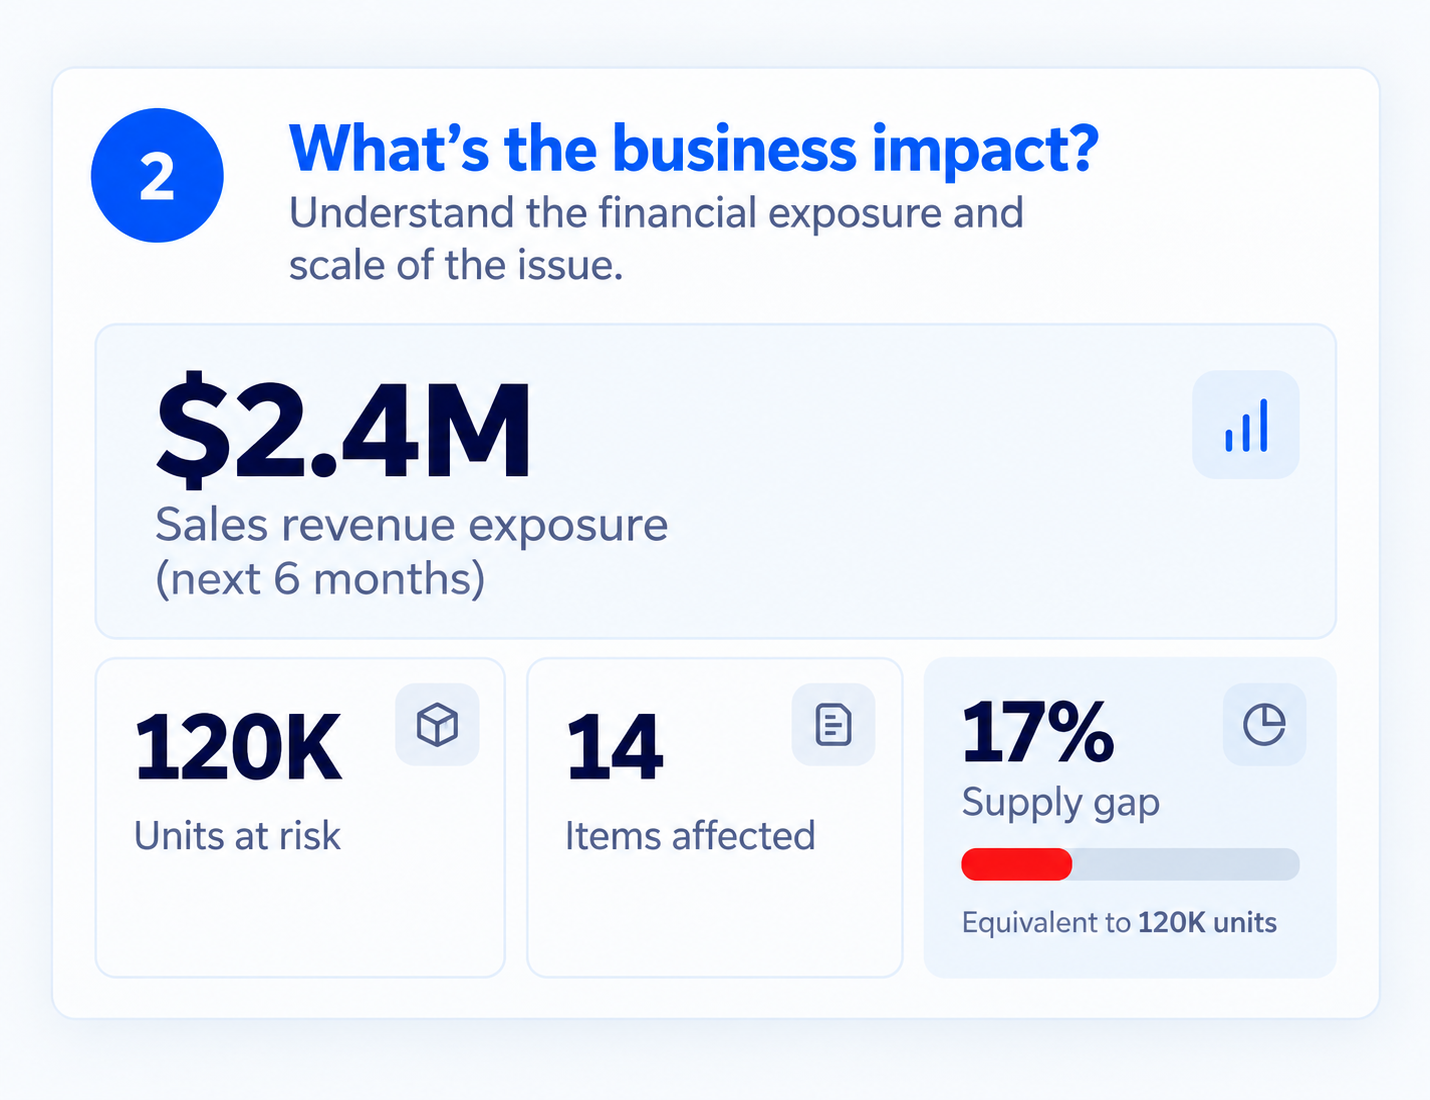
17% of supply is exposed.
120K units and $2.4M in sales revenue exposure over the next six months.
What should happen next?
Mitigate with the current supplier, or move volume to a qualified alternative?
CPMU (Cost per Million Units) is a normalized measure of the cost associated with one million units. It helps teams understand and compare supplier cost efficiency at scale.
- Shows cost efficiency: Makes supplier cost performance easier to understand.
- Enables comparison: Provides a consistent metric for comparing suppliers across different volumes.
- Highlights cost changes: An increase in CPMU can signal that the cost per unit is rising and may require investigation.
- Supports decisions: Gives associates a clear cost signal when evaluating suppliers and making sourcing decisions.
Move from investigating a decline to managing its business impact.
I explored how supplier intelligence could become an AI-assisted continuity workflow.
I identified an opportunity to extend Supplier Matrix beyond information retrieval into decision support, and named the concept Surety. I explored the interaction model, signal interpretation, business-impact visualization, supplier comparison, purchase-order impact and the merchant-control model through rapid prototyping.
Interaction flow · decision-support model · business-impact visualization · supplier comparison · PO impact · recommendation experience · AI interpretation patterns · merchant-control model
Four screens, one continuous decision.
Four linked moments, each testing a different part of the journey from noticing a problem to walking into a negotiation with a plan already in hand.
From quiet decline to flagged risk
Rather than waiting for a merchant to notice a shift, Surety watches on-time delivery, performance, cost and D&B risk together and raises a single, prioritized signal the moment the pattern looks like continuity risk — not just noise.
Design question: How might AI identify and contextualize a meaningful signal rather than add another metric to a dashboard?
From a flagged risk to a dollar number
A performance dip only becomes urgent once it's translated into business terms. Surety converts the signal into sales revenue exposure, units at risk and the size of the supply gap — the numbers a merchant actually needs to prioritize the issue.
Design question: How might AI translate a technical signal into the language merchants already use to make trade-off decisions?
From exposure to qualified alternatives
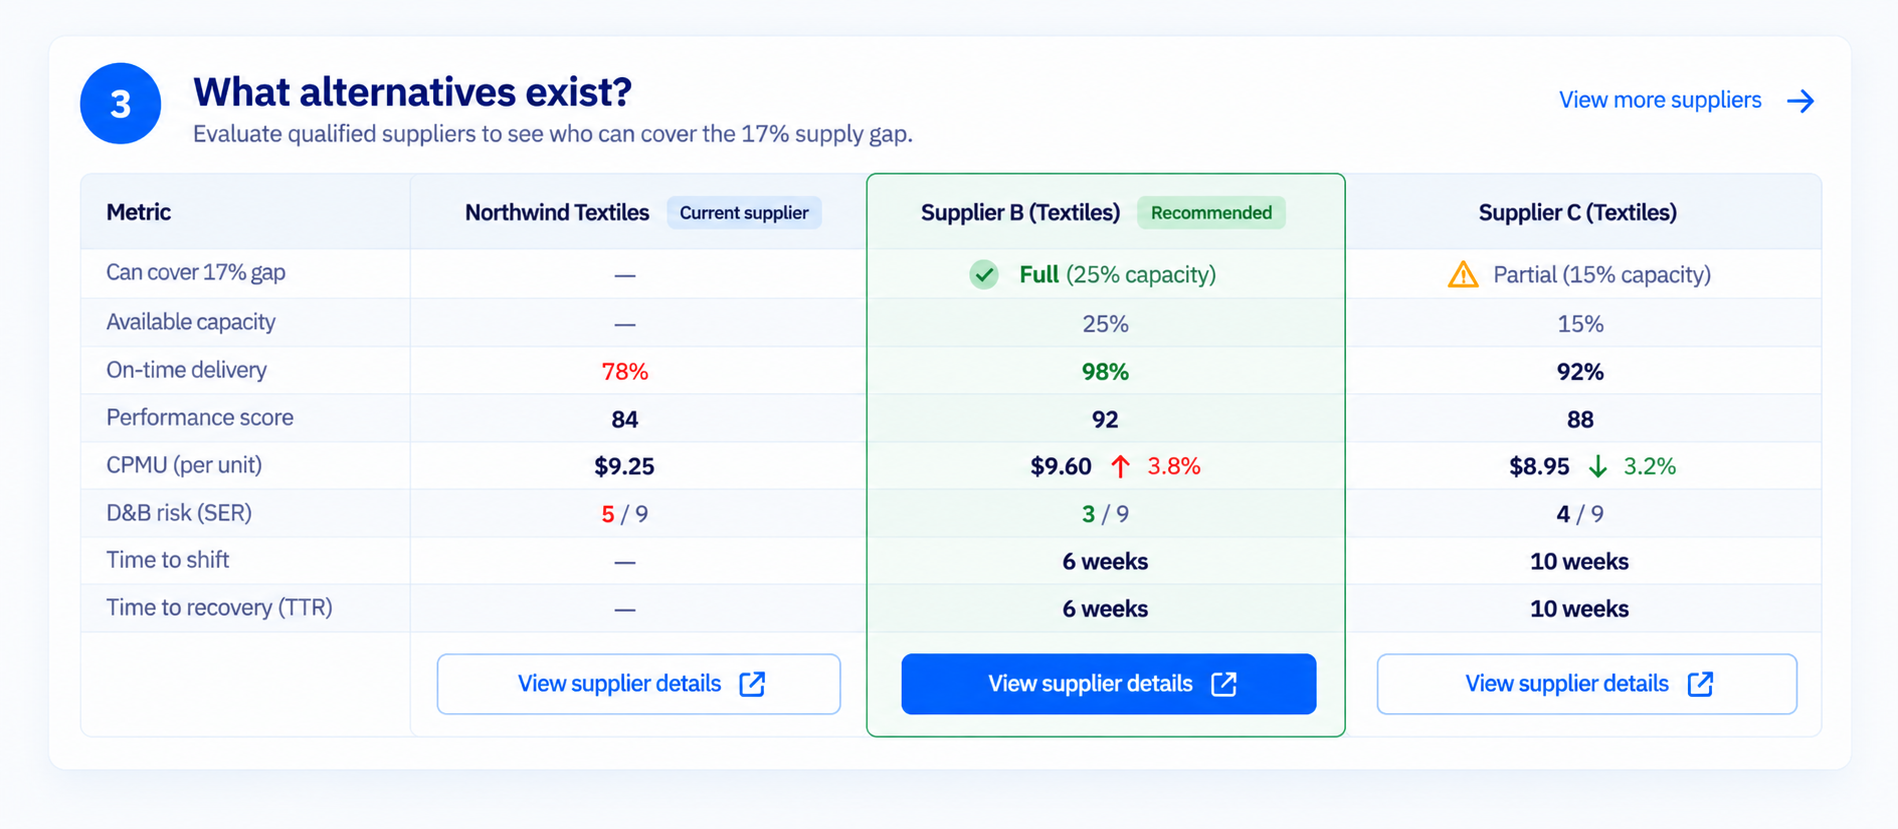
Surety evaluates suppliers who could realistically cover the gap — matching capacity, on-time delivery, CPMU, D&B risk and time to recover — and ranks them, rather than leaving the merchant to build the comparison from scratch.
Design question: How might AI explain why one option is recommended instead of just presenting a ranked list?
From recommendation to a reviewable plan
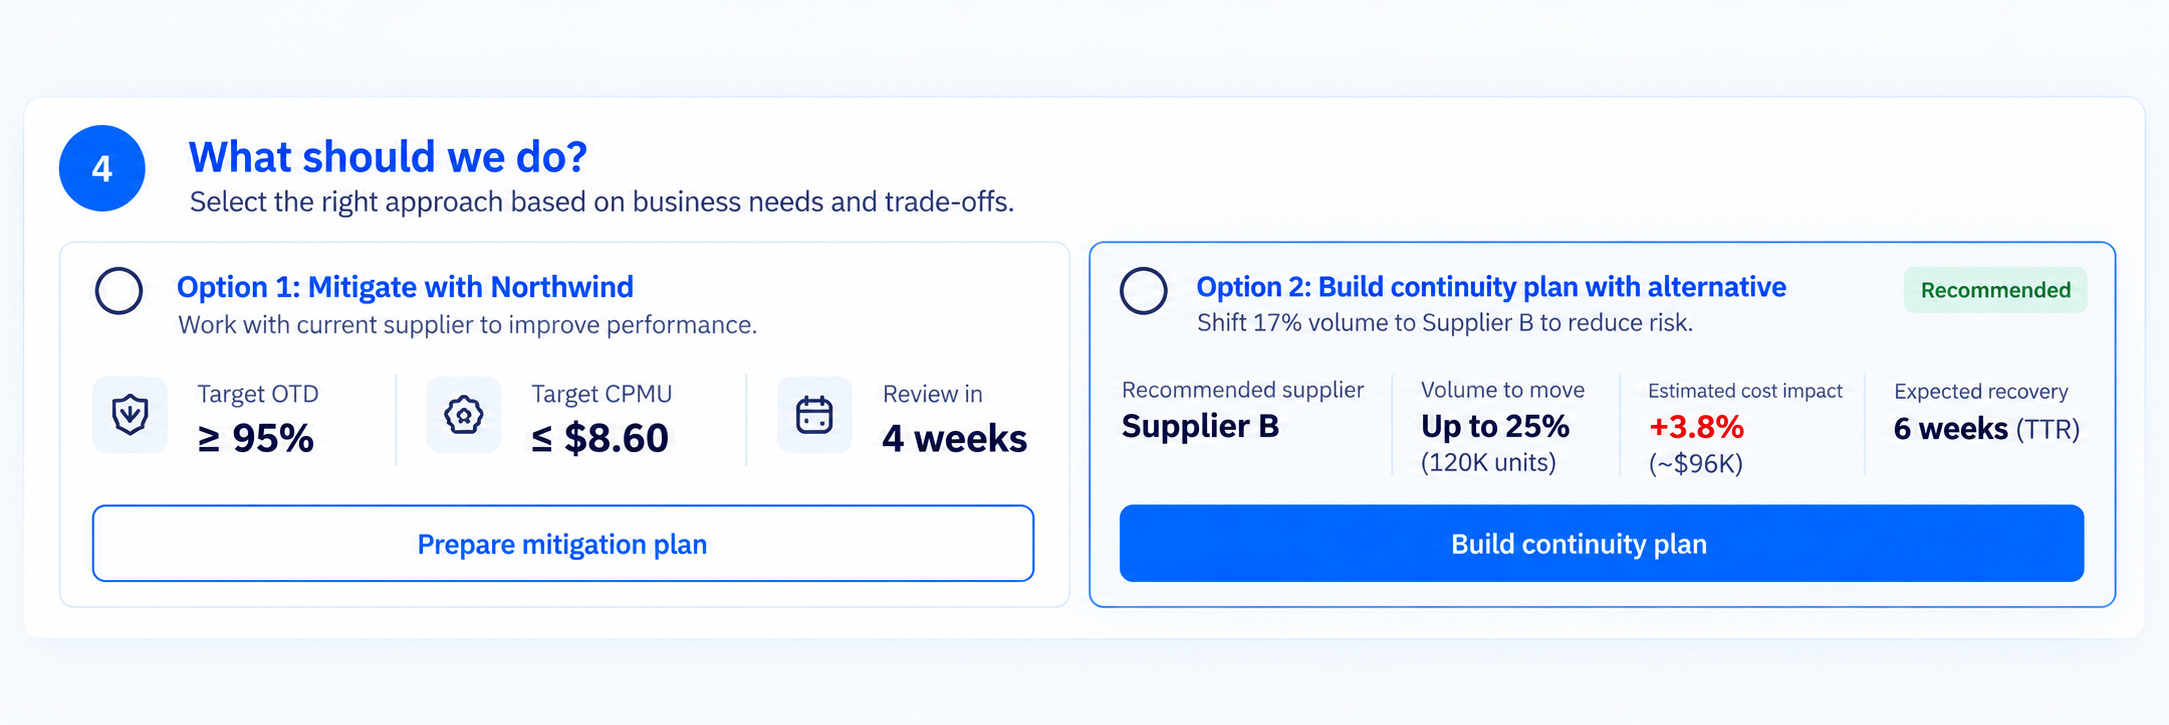
The concept turns the evidence into two concrete paths — mitigate with the current supplier, or build a continuity plan with the recommended alternative — each with clear targets, so the merchant chooses between two well-defined outcomes instead of starting from a blank page.
Design question: How might AI shorten the distance between a recommendation and a decision the merchant is ready to commit to?
From supplier risk to the purchase orders it actually touches.
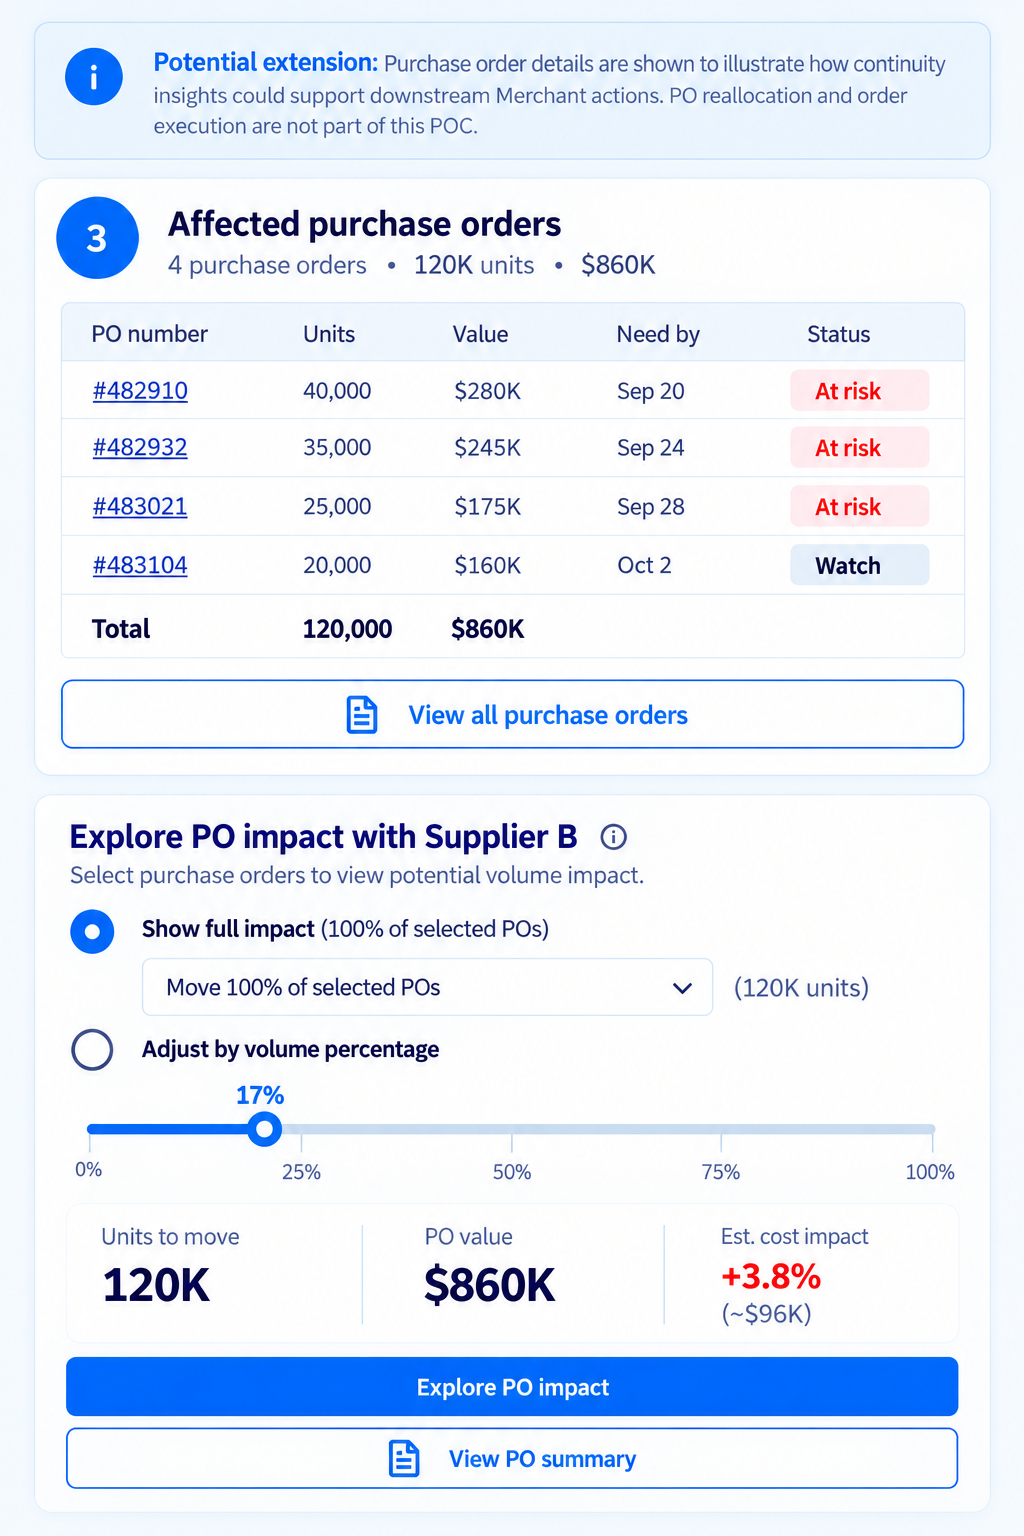
Once a continuity path is on the table, the concept explores connecting supplier-level risk down to the specific purchase orders it affects — so the merchant can see real POs, real need-by dates, and decide how much volume to move, at what pace.
Purchase-order detail is shown to illustrate how continuity insights could support downstream merchant actions. PO reallocation and order execution are not part of this POC.
From decision to specific purchase orders
Surety connects the recommended shift to the exact purchase orders it would touch, lets the merchant explore moving anywhere from a slice to all of the affected volume, and estimates the cost impact of each choice in real time.
Design question: How might AI make a portfolio-level decision concrete enough to act on, order by order?
Explainable, bounded and always reviewable.
Connect relevant evidence, quantify exposure, rank qualified alternatives and draft a reviewable plan — including which purchase orders it would touch.
Independently switch suppliers, reallocate purchase orders or commit to a negotiation. The merchant reviews the evidence and owns the final action.
Every recommendation is paired with the decision signals and trade-offs behind it, so the merchant can understand the reasoning before acting.
The merchant chooses the supplier, the volume and the next action — Surety just gets them to that choice faster.
From viewing metrics to acting on a recommendation.
View supplier metrics
Surface meaningful signals before the merchant has to hunt for them.
Surface meaningful signals
Before the merchant has to hunt for them.
Investigate data manually
Explain why a signal matters and connect it to supplier context.
Explain why it matters
Connect the signal to supplier context and dollars automatically.
Compare suppliers
Recommend relevant alternatives and expose the deciding factors.
Recommend alternatives
Expose the deciding factors behind each option.
Prepare a case manually
Bring cost, performance, capacity, risk and capability into one decision view.
Generate a plan
Down to the purchase orders it would touch.
Prepare manually → Generate a negotiation-ready plan from the underlying intelligence.
Three questions this POC was built to answer.
Explainable recommendations
Can the recommendation be understood, challenged and trusted?
Decision signals
Can the system make the important evidence visible at the moment of decision?
Human-in-the-loop AI
Can AI accelerate analysis while preserving merchant judgment and control?
A decision-support layer, not an autonomous decision-maker.
Surety was explored as a decision-support layer across signal detection, business-impact translation, supplier ranking, recommendation and purchase-order mapping. The surrounding experience — workflow, information architecture, interaction model and visual design — was designed to keep the merchant in control at every step.
From data-heavy workflow to decision-support experience.
This POC demonstrates how I think beyond the immediate interface: identifying where intelligence can reduce cognitive load, making recommendations explainable, and designing AI around the merchant's decision rather than around the technology.
"AI proposes. The merchant decides."